Bs517-Y2Inorganic
AX3 section
BH3
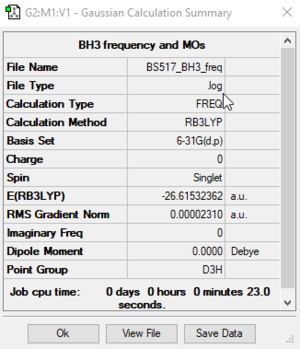
RB3LYP/6-31G(d,p) level
         Item               Value     Threshold  Converged?
 Maximum Force            0.000046     0.000450     YES
 RMS     Force            0.000023     0.000300     YES
 Maximum Displacement     0.000182     0.001800     YES
 RMS     Displacement     0.000091     0.001200     YES
Frequency analysis log file: BS517_BH3_FREQ.LOG
 Low frequencies ---   -0.4072   -0.1962   -0.0055   25.2514   27.2430   27.2460
 Low frequencies --- 1163.1897 1213.3128 1213.3155
BH3 |
| wavenumber (cm-1) | Intensity (arbitrary units) | symmetry | IR active? | type |
| 1163 | 93 | A2' | yes | out-of-plane bend |
| 1213 | 14 | E' | yes | bend |
| 1213 | 14 | E' | yes | bend |
| 2582 | 0 | A1' | no | symmetric stretch |
| 2715 | 126 | E' | yes | asymmetric stretch |
| 2715 | 126 | E' | yes | asymmetric stretch |

We can see that the calculated IR spectrum only shows three peaks, whereas we calculated 6 vibrational modes. The reason for this is that there are two pairs of degenerate vibrations (number 2 and 3 and number 5 and 6) and our symmetric stretch (number 4) is IR inactive because it does not change the dipole moment of the molecule.
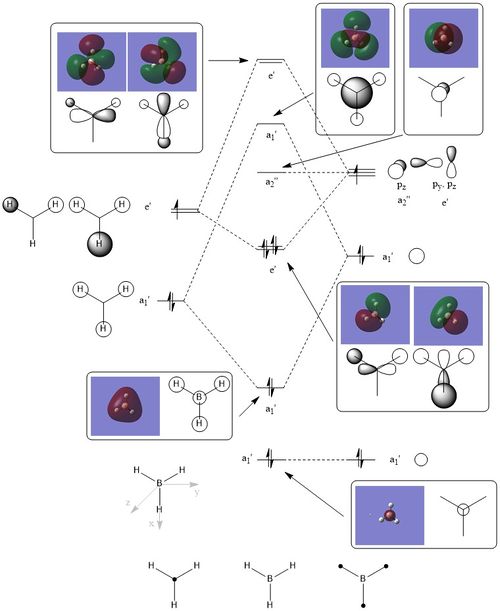
As we can see from the qualitative MO diagram of BH3, the LCAO orbitals are more or less good approximations of the real ones, especially for the more bonding orbitals. The most noticeable differences are that same phase regions close to each other 'fuse together' and opposite phase regions expand much more in the opposite direction. Another difference is the relative sizes of the fragment orbitals. This might be one of the hardest things to predict in qualitative MO diagrams, hand-in-hand with actual MO energy ordering. One more empirical observation is that the more nodes an orbital has (the more anti-bonding it is), the difference between the LCAO and the real orbitals increases. With this in mind, I think it is safe to say, that qualitative MO diagrams and LCAO molecular orbitals are very useful, especially in the bonding and the HOMO-LUMO region, but their accuracy drastically decreases as we go to the anti-bonding region.
Clear inclusion of the MOs with the corresponding LCAOs on to the MO diagram. Very good consideration of the differences between the two, although the 'fusing' together in the calculate MOs is more that by convention, the LCAOs are drawn without this. Smf115 (talk) 20:41, 1 June 2019 (BST)
NH3
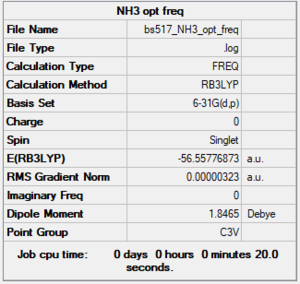
RB3LYP/6-31G(d,p) level
        Item               Value     Threshold  Converged?
Maximum Force            0.000006     0.000450     YES
RMS     Force            0.000004     0.000300     YES
Maximum Displacement     0.000014     0.001800     YES
RMS     Displacement     0.000009     0.001200     YES
Frequency analysis log file: BS517 NH3 OPT FREQ.LOG
Low frequencies ---   -0.0128   -0.0020    0.0018    7.1034    8.1048    8.1051
Low frequencies --- 1089.3834 1693.9368 1693.9368
NH3 |
NI3
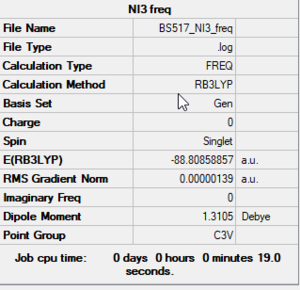
RB3LYP/6-31G(d,p)LANL2DZ level
        Item               Value     Threshold  Converged?
Maximum Force            0.000002     0.000450     YES
RMS     Force            0.000002     0.000300     YES
Maximum Displacement     0.000024     0.001800     YES
RMS     Displacement     0.000014     0.001200     YES
Frequency analysis log file: BS517 NI3 FREQ.LOG
Low frequencies ---  -12.5520  -12.5458   -6.0044   -0.0040    0.0191    0.0664
Low frequencies ---  100.9969  100.9976  147.3377
NI3 |
N-I bond distance: 2.184 Å
NH3BH3 section
NH3BH3
RB3LYP/6-31G(d,p) level
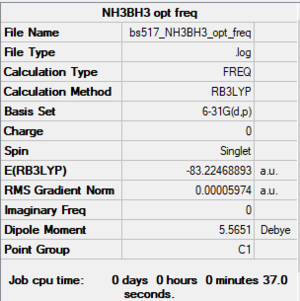
        Item               Value     Threshold  Converged?
Maximum Force            0.000123     0.000450     YES
RMS     Force            0.000058     0.000300     YES
Maximum Displacement     0.000585     0.001800     YES
RMS     Displacement     0.000320     0.001200     YES
Frequency analysis log file: BS517 NH3BH3 OPT FREQ.LOG
Low frequencies ---   -0.0015   -0.0013   -0.0001   16.8436   17.4462   37.3291
Low frequencies ---  265.8243  632.2043  639.3227
NH3 |
NH3BH3 bond energies
E(NH3)=-56.558±0.002 Eh
E(BH3)=-26.615±0.002 Eh
E(NH3BH3)=-83.225±0.002 Eh
ΔE=E(NH3BH3)-[E(NH3)+E(BH3)] = -0.052±0.006 Eh = -136±15 kJ/mol
This is much less negative than the bond association energy of it's isoelectronic counterpart, ethane (ΔE=-377 kJ/mol[1]) (i.e. the H3N–BH3 bond is much weaker than the H3C–CH3 bond). As it is weaker than a notoriously weak peroxide bond (O–O single bond, ΔE=-142 kJ/mol[2]), we can safely say that it is a very week bond.
Very good calculation and comparison to a relevant and referenced bond, great! Just note, energies in a.u. can be left to 5 d.p. in terms of accuracy. Smf115 (talk) 20:47, 1 June 2019 (BST)
Project: isoelectronic d6 metal carbonyls
This project was done in collaboration with Nicholas Walker[3]. Both of us ran three calculations, all log and checkpoint files were shared after the calculations.
[Cr(CO)6]
RB3LYP/6-31G(d,p)LANL2DZ level
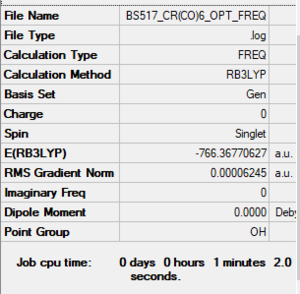
        Item               Value     Threshold  Converged?
Maximum Force            0.000110     0.000450     YES
RMS     Force            0.000041     0.000300     YES
Maximum Displacement     0.000705     0.001800     YES
RMS     Displacement     0.000334     0.001200     YES
Frequency analysis log file: BS517 CR(CO)6 OPT FREQ.LOG
Low frequencies ---    0.0011    0.0011    0.0012   11.7482   11.7482   11.7482
Low frequencies ---   66.6574   66.6574   66.6574
Cr(CO)6 |
Results in agreement with those of Nicholas Walker.[3]
[V(CO)6]-
RB3LYP/6-31G(d,p)LANL2DZ level
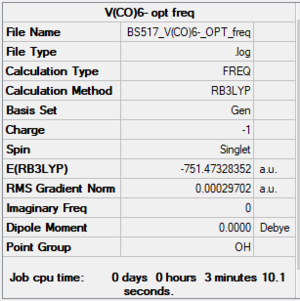
        Item               Value     Threshold  Converged?
Maximum Force            0.000390     0.000450     YES
RMS     Force            0.000162     0.000300     YES
Maximum Displacement     0.001626     0.001800     YES
RMS     Displacement     0.000709     0.001200     YES
Frequency analysis log file: BS517 V(CO)6- OPT freq.log
Low frequencies ---   -0.0006    0.0002    0.0011   13.1372   13.1372   13.1372
Low frequencies ---   52.2227   52.2228   52.2228
[Mn(CO)6]+
RB3LYP/6-31G(d,p)LANL2DZ level
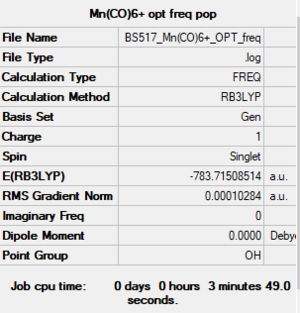
        Item               Value     Threshold  Converged?
Maximum Force            0.000179     0.000450     YES
RMS     Force            0.000067     0.000300     YES
Maximum Displacement     0.001359     0.001800     YES
RMS     Displacement     0.000648     0.001200     YES
Frequency analysis log file: BS517 Mn(CO)6+ OPT freq.log
Low frequencies ---   -0.0012   -0.0011   -0.0008    7.2213    7.2214    7.2214
Low frequencies ---   76.3323   76.3323   76.3323
[Ti(CO)6]2-
Results taken from Nicholas Walker.[3]
[Fe(CO)6]2+
Results taken from Nicholas Walker.[3]
Results
Prediction and computational measurement of the changes in C‑O and M‑C bond lengths and C‑O stretching frequencies
| Property | Predicted trend | [Ti(CO)6]2- | [V(CO)6]- | [Cr(CO)6] | [Mn(CO)6]+ | [Fe(CO)6]2+ | Trend |
| Total charge | 2- | 1- | 0 | 1+ | 2+ | ||
| Metal oxidation state | -2 | -1 | 0 | +1 | +2 | ||
| C‑O bond length, d(C‑O)/Å | Predicted to decrease along the period due to decreasing back-donation into C‑O π* orbitals with increasing metal oxidation state. The back-donation destabilises the C‑O bonds, making them longer. | 1.183 | 1.658 | 1.149 | 1.136 | 1.126 | As predicted, the C‑O bond length decreases with the decreasing electron density on the metal. This is primarily due to back-donation from the M d orbitals into the empty π*(C‑O) orbitals. This interaction increases the overall stability of the complex, but decreases the C‑O bond order (and thus bond strength). The less electron density there is on the metal, the less prominent this effect gets. For the Fe complex, d(C‑O) is equal (within experimental error) to the C‑O bond length in carbon monoxide (d(CO)=1.1283 Å[1]), meaning that in that complex, there is no significant back-donation present. |
| M‑C bond length, d(M‑C)/Å | Predicted to mostly depend on two factors. Moving along the period the increasing metal oxidation state decreases back-donation and weakens the M‑C bonds making them longer. Having a higher nuclear charge for the same number of electrons around the metal centre means more contracted d orbitals and shorter M‑C bonds. Qualitative predictions of the relative intensity of these effects is hard, my prediction is an increasing M‑C bond length due to decreasing back-donation. | 2.047 | 1.954 | 1.915 | 1.909 | 1.942 | d(M‑C) starts decreasing as we move along the period, but we hit a minimum at the 1+ charged metal centre state (Mn). (Also, the M‑C bond length in the neutral Cr complex is very similar to this.) As discussed before, more electron density means more back donation, but less electron density means more d orbital contraction. Having the shortest M‑C in the 1+ case means, that the d orbital contraction seems to be more significant than the back-donation, contrary to my prediction. Another possible explanation is that this trend of decreasing M‑C bond length in part comes from the inaccuracies of the B3LYP basis set when used for d orbitals. |
| C‑O asymmetric stretching frequency, ν(C‑O)/cm-1 | Predicted to increase along the period due to increasing C‑O bond strength. | 1857 | 1970 | 2086 | 2199 | 2297 | IR stretching frequencies are really good indicators of bond strengths. As predicted, stretching frequencies increase moving along the period due to decreasing back-donation, this results in stronger C‑O bonds. These triply degenerate asymmetric stretches are IR active (they change the net dipole moment of the complex), and as such, they can be measured and confirmed experimentally. |
| C‑O totally symmetric stretching frequency, ν(C‑O)/cm-1 | Predicted to increase along the period due to increasing C‑O bond strength. | 1992 | 2097 | 2189 | 2265 | 2322 | For the same reason as for the asymmetric stretching frequencies, the symmetric stretching frequencies increase as well as we move to the right in the periodic table. As these totally symmetric stretches do not change the net dipole moment of the complex, they are IR inactive, and cannot be measured experimentally. Their computational predictions should however be just as accurate as that the asymmetric ones. |
| Charge on the M, Q/e | Predicted to be similar to, but always more than the oxidation state, because the σ donating character of the COs is less significant than the back-donation. Charge increases going to the right. | -1.044 | -0.937 | -0.713 | -0.538 | -0.481 | Results very surprising, all metals are negatively charged. Prediction was only accurate qualitatively in terms of the trend; the charge density of the metal centre increases going to the right because of the increasing nuclear charge in the isoelectronic complexes. For the negatively charged complexes, back-donation is very strong, so much of the metal electron density is given away to the COs. For the positively charged complexes back-donation is much less significant, even though CO donates a pair of electrons to the metal centre in a σ fashion. |
Very good prediction of several trends and the use of all 5 compounds, great work! Your explanation of the trends observed is clear and correct in the majority of cases and some of the details e.g. comparing the C=O bond length in the Fe complex to the standard C=O bond length, are really good. A few areas of improvement would be to have plotted some of the data, and considered why back-bonding increases with oxidation state and maybe why the charges are all negative? (Note, the charges used should have been the NBO ones too. Smf115 (talk) 13:45, 31 May 2019 (BST)
Molecular orbitals of the [Cr(CO)6] complex
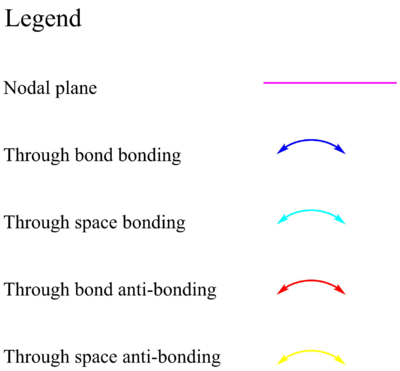
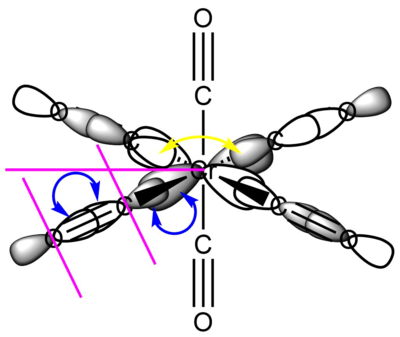
For clarity, only one of each type of interaction and nodal plane is drawn, the other symmetry related ones are omitted.
MO 42: eg
This filled metal based eg orbital is one of a set of two degenerate valence bonding orbitals. It is based on the Cr dx2-y2 orbital (it's degenerate pair uses the Cr dz2 orbital) forming σ bonds with the four COs that are in the xy plane. The interacting ligand orbitals are C-O p-p σ bonding orbitals. Due to all the through bond bonding interactions on every bond (and only a small number of though space anti-bonding interactions), this is an overall strongly bonding valence MO.
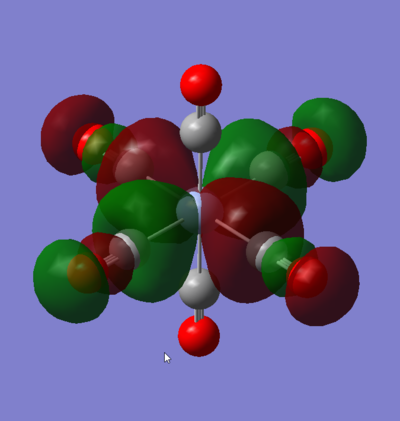
MO 48: t2g
This strongly metal based t2g is one of the triply degenerate HOMOs of the complex. It is comprised of the Cr dxy orbital forming four π bonds with the CO π* orbitals that are in its plane, its degenerate counterparts are the same in the xz and yz planes. As such, it is responsible for the back-donation of electrons from the metal centre into the CO π* orbitals. This significantly increases M-CO bonding, but decreases C-O bond strength. This means that the HOMO of this Cr carbonyl complex has an overall bonding character.
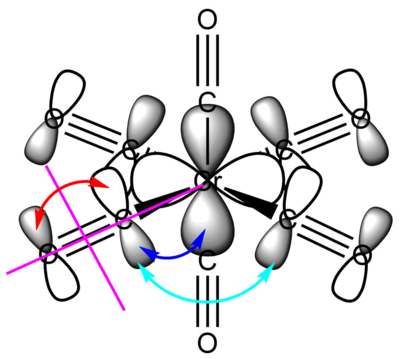
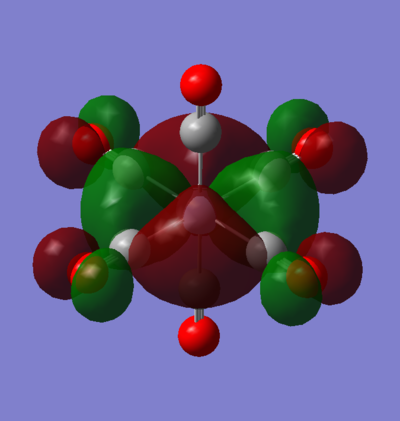
MO 55: t2g
This t2g orbital is one of the doubly degenerate LUMO+1 orbitals of the complex. It is entirely ligand based as there are no M orbitals of the correct symmetry to interact with it. It comprises of CO π* orbitals in a configuration, that is entirely anti-bonding via through bond and through space π* interactions with nodal planes going between all two directly interacting orbitals.
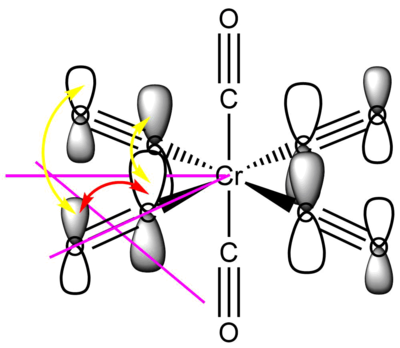
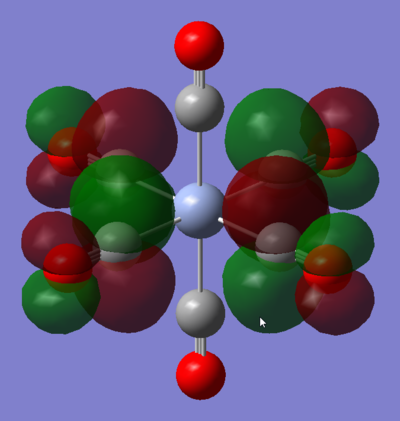
Very clear MO analysis on a good selection of MOs. Your LCAOs are correct and have been presented clearly (although note that an axis should usually be included to show the orientation). You've highlighted the main interactions well and have also commented on the degeneracy which is great. To improve, the overall character of each of the MOs could have been evaluated and consider other details such as the relative contributions in the ligand FOs. Overall, a great project section! Smf115 (talk) 13:53, 31 May 2019 (BST)
