BO1593
EX3 molecules
Analysis of BH3
B3LYP/6-31G level
Item table:
 Item               Value     Threshold  Converged?
 Maximum Force            0.000203     0.000450     YES
 RMS     Force            0.000098     0.000300     YES
 Maximum Displacement     0.000867     0.001800     YES
 RMS     Displacement     0.000415     0.001200     YES
Optimization was successful.
Frequency analysis
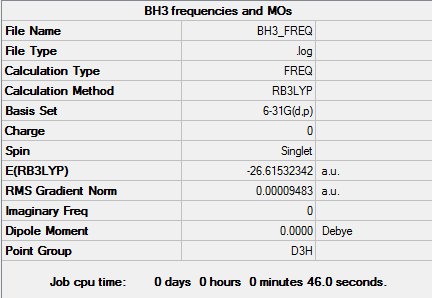
log file: https://wiki.ch.ic.ac.uk/wiki/images/0/0c/MARINE_BH3_SYM_OPT_CALCULS.LOG
Low frequencies ---   -0.2260   -0.1036   -0.0055   48.0278   49.0875   49.0880
Low frequencies --- 1163.7224 1213.6715 1213.6741
BH molecule |
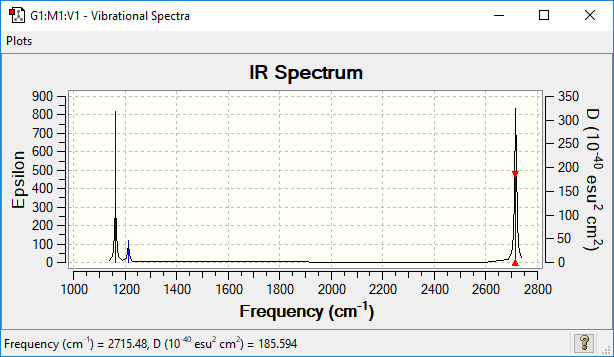
IR frequencies
| wavenumber (cm-1 | Intensity (arbitrary units) | symmetry | IR active? | type |
| 1163 | 92 | A2′′ | yes | out-of-plane bend |
| 1213 | 14 | E' | very slight | bend |
| 1213 | 14 | E' | yes | asymmetric bend |
| 2580 | 0 | A1′′ | no | symmetric stretch |
| 2713 | 126 | E' | yes | asymmetric stretch |
| 2714 | 126 | E' | yes | asymmetric stretch |
Only six IR vibrations are observed experimentally, this is because not all vibrations lead to a change in the dipole moment of the molecule, hence don't lead to an absorption peak in the infrared spectrum. These modes are the symmetric bending mode 2 and the symmetric stretch 4. The two lasts modes give rise to the same absorption peak in the IR spectra. Hence despite having 6 vibrational modes, BH3 only has 3 peaks in its IR spectrum.
MO diagram for BH3

Theoretical molecular orbitals are close to the real ones, with the electron density being more spread in the case of the a1' real molecular orbital than in the LCAOs. The only one differing significantly is the a1' MO has the green lobes much bigger than in the LCAO approximation. This shows that molecular theory is a very powerful tool to have a qualitative understanding of the real molecular orbitals without having to go through the lengthy calculations.
This MO diagram has been taken from Prof. Hunt's website[1], all computed molecular orbitals were generated by me in the lab.
NH3 molecule
B3LYP/6-31G level
Item table:
Item               Value     Threshold  Converged?
 Maximum Force            0.000005     0.000450     YES
 RMS     Force            0.000003     0.000300     YES
 Maximum Displacement     0.000010     0.001800     YES
 RMS     Displacement     0.000007     0.001200     YES
Frequency analysis:
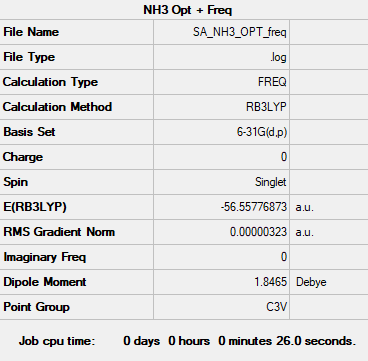
Low frequencies ---  -11.6527  -11.6490   -0.0041    0.0333    0.1312   25.5724
Low frequencies --- 1089.6616 1694.1736 1694.1736
Frequency log file: https://wiki.ch.ic.ac.uk/wiki/images/7/72/NH3_FREQUENCY.LOG
BH molecule |
NH3-BH3 molecule
B3LYP/6-31G level
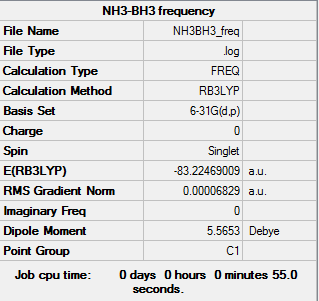
The optimization didn't quite get the point group correctly, the point group for this molecule should be C3v.
Item table:
 Item               Value     Threshold  Converged?
 Maximum Force            0.000139     0.000450     YES
 RMS     Force            0.000063     0.000300     YES
 Maximum Displacement     0.000771     0.001800     YES
 RMS     Displacement     0.000338     0.001200     YES
Frequency analysis
Low frequencies ---    0.0005    0.0008    0.0008   19.1051   23.7888   42.9638
Low frequencies ---  266.5908  632.3824  639.5318
frequency log file: https://wiki.ch.ic.ac.uk/wiki/images/3/33/NH3BH3_FREQ.LOG
BH NH-BH |
Computed energies
E(NH3)=-56.55776873 a.u.
E(BH3)=-26.61532342 a.u.
E(NH3BH3)=-83.22469009 a.u.
Association energy:
ΔE=E(NH3BH3)-[E(NH3)+E(BH3)]
ΔE=-83.22469009 - [-83.17309215]
ΔE=-0.05159794 a.u.
Dissociation energy:
ΔE=[E(NH3)+E(BH3)]-E(NH3BH3)
ΔE= 0.05159794 a.u.
ΔE=+135 kJ.mol
Ng611 (talk) 23:12, 15 May 2018 (BST) Well done for getting the correct answer. A comparison to a known bond enthalpy (ideally from a textbook, databook, or paper) would allow you to assess the strength of this interaction.
BBr3 molecule
GEN/6-31G level
Item table:
Item               Value     Threshold  Converged?
 Maximum Force            0.000015     0.000450     YES
 RMS     Force            0.000009     0.000300     YES
 Maximum Displacement     0.000101     0.001800     YES
 RMS     Displacement     0.000058     0.001200     YES
Frequency analysis:
Low frequencies ---   -0.0145   -0.0064   -0.0046    2.2825    2.2825    4.7693
Low frequencies ---  155.9653  155.9673  267.7173
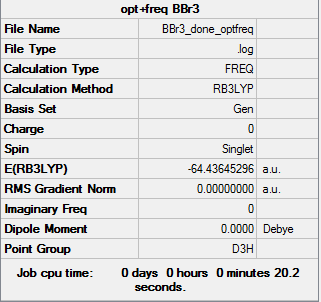
Log file for BBr3 with both optimization and frequency: https://wiki.ch.ic.ac.uk/wiki/images/4/45/BBr3_done_optfreq.log
BH BBr3 |
Project: Aromaticity
Benzene
B3LYP/6-31G level
Item table:
Item               Value     Threshold  Converged?
 Maximum Force            0.000212     0.000450     YES
 RMS     Force            0.000085     0.000300     YES
 Maximum Displacement     0.000991     0.001800     YES
 RMS     Displacement     0.000315     0.001200     YES
Optimization was successful.
Frequency analysis
Low frequencies ---  -17.0537  -14.3774   -9.3919   -0.0010   -0.0010   -0.0003
Low frequencies ---  413.7989  414.4772  620.8619
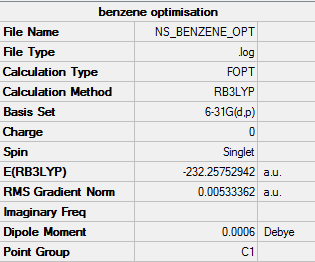
Log file for the frequency analysis: https://wiki.ch.ic.ac.uk/wiki/images/f/fe/BENZENE_FREQ.LOG
BH Benzene |
Charge distribution analysis
    Atom  No    Charge
 ----------------------
      C    1   -0.23852
      C    2   -0.23855
      C    3   -0.23854
      C    4   -0.23852
      C    5   -0.23855
      C    6   -0.23854
      H    7    0.23854
      H    8    0.23853
      H    9    0.23854
      H   10    0.23854
      H   11    0.23853
      H   12    0.23854
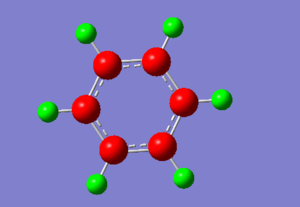
The table above generated by Gaussview shows that the electron density is concentrated on the carbon atoms in benzene, while the hydrogen atoms have a slightly positive charge. This is confirmed by looking at the charge distribution on the image above, where atoms coloured in green show the greatest electron density. Due to the exceptionally high symmetry of benzene, all carbon and hydrogen atoms have the same charge distribution.
Molecular orbital diagram for benzene
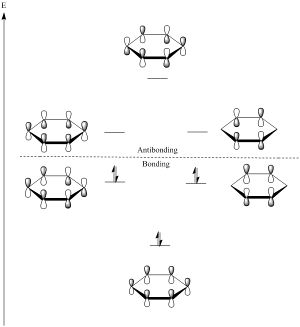
The diagram is generated using LCAO theory, by combining the 6 p atomic orbitals combine to make 6 new molecular orbitals, and shows that lowest and highest energy MOs have unique energy levels while the other 4 form a pair of degenerate orbitals.
All carbons are sp2 hybridized in the molecule, with the pz atomic orbitals perpendicular to the plane of the ring. As seen in the charge distribution analysis, this is indeed how electron density is spread out in benzene, with electrons above and below the plane of the ring. The 4n+2 rule arises from the fact that the lowest energy orbital is filled by 2 electrons while each degenerate orbital requires 4 electrons. In benzene the 6 p electrons fill all the bonding molecular orbitals, giving benzene special stability.
Borazine
B3LYP/6-31G level
Item table:
 Item               Value     Threshold  Converged?
 Maximum Force            0.000093     0.000450     YES
 RMS     Force            0.000033     0.000300     YES
 Maximum Displacement     0.000338     0.001800     YES
 RMS     Displacement     0.000096     0.001200     YES
Optimization was successful.
Frequency analysis
Low frequencies ---  -17.0480  -10.8524   -5.5074   -0.0007    0.0003    0.0005
Low frequencies ---  288.8383  289.6947  404.1676
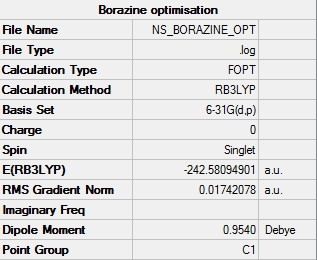
Frequency log file: https://wiki.ch.ic.ac.uk/wiki/images/5/59/BORAZINE_FREQ.LOG
BH Borazine |
Charge distribution analysis
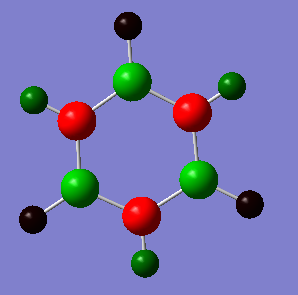
    Atom  No    Charge
 ----------------------
      H    1   -0.07654
      H    2    0.43199
      H    3   -0.07655
      H    4    0.43198
      H    5   -0.07654
      H    6    0.43198
      B    7    0.74700
      B    8    0.74696
      B    9    0.74695
      N   10   -1.10240
      N   11   -1.10240
      N   12   -1.10241
The atoms colored in green correspond to the boron atoms, this shows with support from the charge values in the table that electron density is low on the boron atoms. This is sensible since boron is the most electropositive atom in borazine. The nitrogen atoms concentrate most of the electron density due to their high electron withdrawing ability. The hydrogen atoms behave in different ways depending on what atom they are bonded to. The ones attached to N have less electron density than the ones bonded to B and are even slightly electropositive, with a charge value of 0.23 compared to a negative value of -0.07 for hydrogens attached to N. Hence borazine has an uneven distribution of electron density.
Ng611 (talk) 23:10, 15 May 2018 (BST) A good comparative discussion. Remember to use the same colour scale for benzene and borazine for ease of visual comparison. What was the total sum of the partial charges?
Aromaticity
A molecule is aromatic if it follows the following criteria:
- Molecule must be cyclic
- Ring must be planar
- Each atom in the ring must be sp2 hybridized
- The number of pi electrons in the ring must be 4n+2
The last point is know as Huckel's rule, and it can be seen that both the molecules studied here do follow this rule since benzene and borazine are isoelectronic, they have 6 pi electrons which fill up the lowest enrgy molecular orbitals first, following the Aufbau principle. The molecules are also isostructural and have a planar ring geometry with p-orbitals perpendicular to the plane of the ring.
However, it has been shown that borazine has an uneven electron density because of the electronegativity differences between the boron and nitrogen atom. Natural chemical shielding analysis provides evidence for aromaticity in borazine, based on the contribution from the B-N π bond to the bonding. This π bond induces a weak ring current which suggests delocalization.
Overall borazine is less aromatic than benzene due to the electronegativity difference leading to a weaker B-N bond and increased electron localisation on the nitrogen atoms and hydrogens bonded to the boron atoms.
Comparing Benzene and Borazine
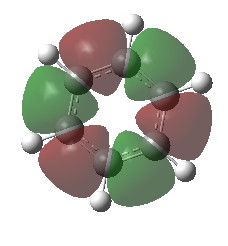
Benzene and borazine are both aromatic molecules with delocalized electron over the whole planar molecule. However, their molecular orbitals differ to some extent partly because in borazine the ring is made of boron and nitrogen atoms which leads to a significant difference in electronegativities and thus uneven electron distribution. In benzene however, the ring is made of carbon atoms and doesn't have an uneven electron distribution. A charge distribution analysis of both molecules was performed using Gaussview and the results are compared in the table below.
| Benzene | Borazine | Comments |
 |
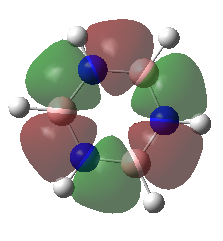 |
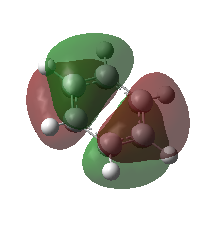
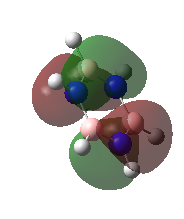
These orbitals are very similar in shapes, excluding all hydrogen atoms from the electron distribution. They are bonding in nature, as they are a combination of p orbitals resulting in positive overlap. The 6 nodes lie along each of the carbon atoms. The MOs although being very similar in shape, do not possess the same energies, the benzene one being lower in energy than for borazine.
Overall character:bonding |
 |
 |
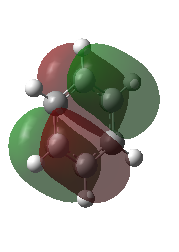
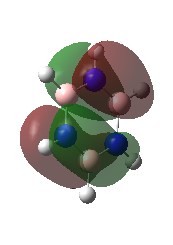
These orbitals are pi molecular orbitals and have 2 nodes.
These are very similar in both molecules with maybe more contribution from the H atoms in the case of benzene. Overall character: anti-bonding |
 |
 |
These are the Highest Occupied Molecular Orbitals.
They are pi molecular orbitals with 2 nodes. They are a combination of in-phase and out of phase p-orbitals. Ng611 (talk) 23:14, 15 May 2018 (BST) What orientation are these orbitals? Overall character: bonding |
Ng611 (talk) 23:14, 15 May 2018 (BST) A good report. Your first section was very good, with only a missing comparison/discussion regarding the strength of the BH3NH3 adduct bond missing and everything else spot on. Your section on benzene/borazine MO analysis was good - a rationalisation of the differences between the orbitals would have improved this further, as would a more sophisticated explanation of the origins of aromaticity, incorporating contemporary ideas and evidence from experiment

