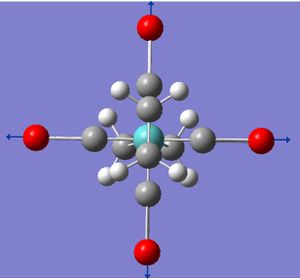
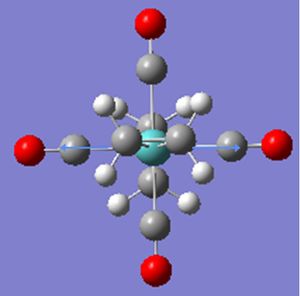
BBC2
Tim Barrett, Chemistry Year Three, Computational Lab 2010
Module Two
Modelling and Optimisation of BH3
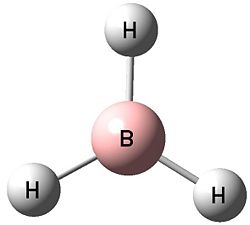
The BH3 molecule was visuallised using the software of Gaussview with a simple molecule arrangement of a central boron with three boron hydrogen bonds. The inital molecule was manipulated so the boron hydrogen bonds were lengthened to 1.5 angstroms from the B-H bond length stored in Gaussview. This model was then used to create a Gaussian input file for geometry optimisation through energy minimisation using the B31YP method ('a popular density functional method offering good reliability and short range electron correlation treatment') and the basis set of 3-21g (a small double-ζ basis set). This input file was submitted to the Gaussian software for calulation and yielded the optimised molecule (right) with a bond length of 1.21 angstroms.
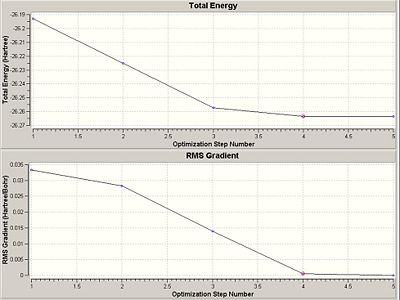
The optimisation successfully converged to the minimum energy in five steps where the rate of change in energy gradient was zero - indicating a minima (software confirms not a maxima through second differential). Optimisation result are given in the graphs below.
Output File: https://www.ch.ic.ac.uk/wiki/index.php/Image:BCL3_PREOPT.LOG
Molecular Orbitals Visualisation of BH3
Using the software of gaussian and the same method and basis set; the molecular orbitals of the BH3 were also calulated using the natural bond orbitals (taking into account the charge distribution of the molecular orbitals and how they interact). The calulated molecular orbitals diagrams (visualised on Gaussview) can be compared to those predicted through linear combination of atomic orbitals (soon in the molecular orbital diagram below).
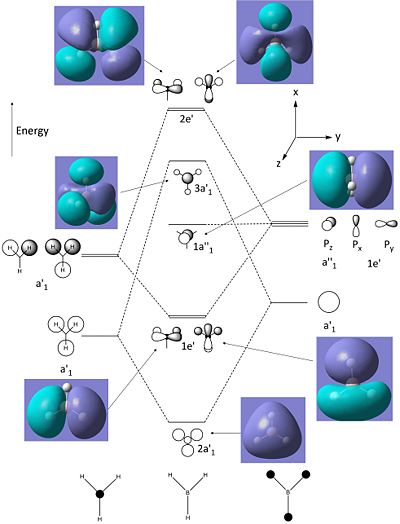
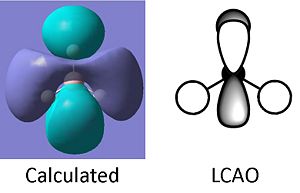
The molecular orbitals calculated shows very good correlation for the bonding and non-binding orbitals. However the two anti-bonding orbitals assigned symmetry of 2e' in the LCAO, through gaussian calculation shows the orbitals as not degenerate between the orbitals with the lower energy orbital (see below) showing a smaller no. of nodes (2 rather than 4) than predicted in LCAO (possibly accounting for the lower energy), thus the correlation with LCAO does not hold true for all anti-bonding orbtials.
Natural Bond Orbtial Analysis of BH3
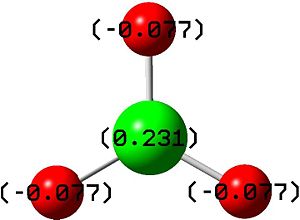
The natural bond orbitals analysis gives information about the atomic charges within the molecule and the nature of the bonding. Below is a graphical representation of the charges in the BH3 molecule and the relevant section of the Gaussian Output file. As can be seen the central boron has a atomic charge of 0.231 coulombs and the surrounding hydrogens each having a charge of -0.077 coulombs equating to a neutral molecule with D3h symmetry.
                                      Natural Population
               Natural  -----------------------------------------------
   Atom  No    Charge         Core      Valence    Rydberg      Total
-----------------------------------------------------------------------
     B    1    0.23092      1.99894     2.77013    0.00000     4.76908
     H    2   -0.07697      0.00000     1.07662    0.00036     1.07697
     H    3   -0.07697      0.00000     1.07662    0.00036     1.07697
     H    4   -0.07697      0.00000     1.07662    0.00036     1.07697
=======================================================================
  * Total *    0.00000      1.99894     5.99999    0.00107     8.00000
From the orbtials contribution (see relevant section of output file below) the sp2 nature of the boron can clearly seen by the 2:1 ratio (33.33%:66.66%)of contribution of p to s in each boron hydrogen bond.
---------------------------------------------------------------------------------
    1. (1.99838) BD ( 1) B   1 - H   2
               ( 46.16%)   0.6794* B   1 s( 33.33%)p 2.00( 66.67%)
                                           0.0000  0.5774  0.0000  0.0000  0.0000
                                           0.8165  0.0000  0.0000  0.0000
               ( 53.84%)   0.7337* H   2 s(100.00%)
                                           1.0000 -0.0001
    2. (1.99838) BD ( 1) B   1 - H   3
               ( 46.16%)   0.6794* B   1 s( 33.33%)p 2.00( 66.67%)
                                           0.0000  0.5774  0.0000  0.7071  0.0000
                                          -0.4082  0.0000  0.0000  0.0000
               ( 53.84%)   0.7337* H   3 s(100.00%)
                                           1.0000 -0.0001
    3. (1.99838) BD ( 1) B   1 - H   4
               ( 46.16%)   0.6794* B   1 s( 33.33%)p 2.00( 66.67%)
                                           0.0000  0.5774  0.0000 -0.7071  0.0000
                                          -0.4082  0.0000  0.0000  0.0000
The summary of the NBO (below) shows the three B-H bonds (1-3) with an occupancy of approximately 2 electrons and two electrons on the core low lying boron S orbital. The summary also explains the BH3 lewis acidic nature with the low energy unoccupied orbital (no. 8 Pz) that can accept electrons.
                                                           Principal Delocalizations
          NBO                        Occupancy    Energy   (geminal,vicinal,remote)
====================================================================================
Molecular unit  1  (H3B)
    1. BD (   1) B   1 - H   2          1.99838    -0.40373
    2. BD (   1) B   1 - H   3          1.99838    -0.40373
    3. BD (   1) B   1 - H   4          1.99838    -0.40373
    4. CR (   1) B   1                  1.99894    -6.33321  10(v),11(v),12(v)
    5. LP*(   1) B   1                  0.00000     0.63303
    6. RY*(   1) B   1                  0.00000     0.32528
    7. RY*(   2) B   1                  0.00000     0.32528
    8. RY*(   3) B   1                  0.00000    -0.11859
    9. RY*(   4) B   1                  0.00000     0.37749
   10. RY*(   1) H   2                  0.00036     0.86030
   11. RY*(   1) H   3                  0.00036     0.86030
   12. RY*(   1) H   4                  0.00036     0.86030
   13. BD*(   1) B   1 - H   2          0.00161     0.32453
   14. BD*(   1) B   1 - H   3          0.00161     0.32453
   15. BD*(   1) B   1 - H   4          0.00161     0.32453
BH3 Vibrations
The vibration of the BH3 molecule were calculated on the optimised molecule using the Gaussian program with the same method and basis set (relevant input code can be seen below).
# freq b3lyp/3-21g geom=connectivity pop=(full,nbo)
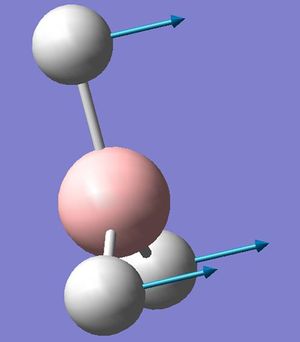
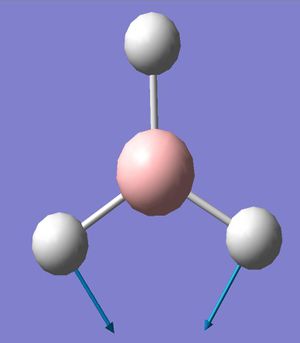
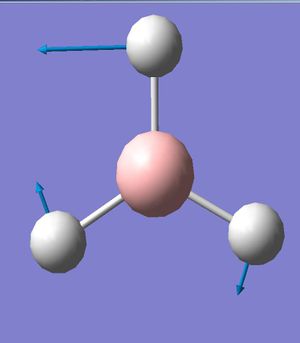
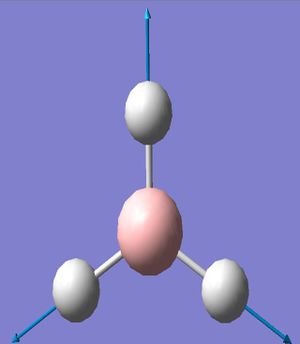
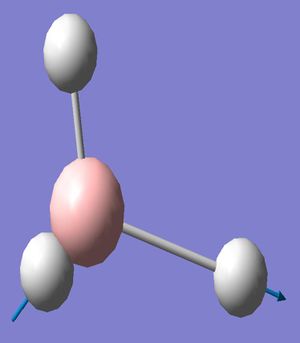
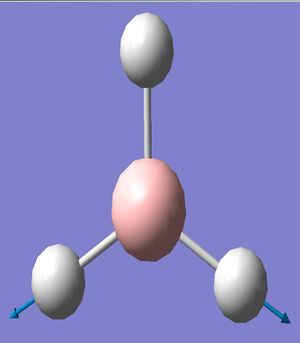
The calculation yielded six vibrational frequencies which were visualised using Gaussview. Below is snapshots of the vibrational displacement and their frequency.
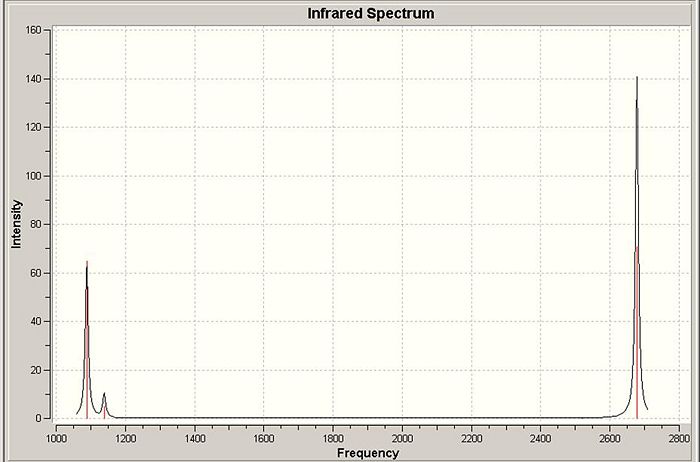
The above predicted infrared spectrum shows only three peaks reflecting the two doublely degenerate vibrations at 2678 and 1139 cm-1 (although slight difference in energy between vibrations - too small to measure) and the vibration at 1088 cm-1. The lack of a infrared peak at 2520 cm-1 for the A1 vibration is explain through the selection rule that to be infrared active the vibration must create a change in dipole moment - as the A1 is completely symmetric no such change is created.
Output file: https://www.ch.ic.ac.uk/wiki/index.php/Image:BH3_FOR_VIBRATIONSINPUT.LOG
Optimisation of BCl3
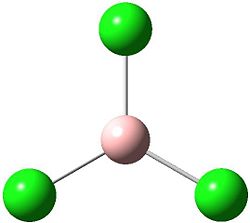
The optimised BH3 structure was manipulated in Gaussview to substututed the three hydrogens for chlorine groups creating the molecule BCl3, the structure was then restricted to a symmetry of D3h with a small tolerance of 0.0001. This new model was then used to create a Gaussian input file for geometry optimisation through energy minimisation using again B31YP method and the basis set of LanL2MB (a medium level basis set). This input file was submitted to the Gaussian software for calulation and yielded the optimised molecule (right) with a bond length of 1.87 angstroms and bond angle of 120°.
Output file: https://www.ch.ic.ac.uk/wiki/index.php/Image:BCL3_VIBRATIONS.LOG
Vibrational Analysis of BCl3
A method of confirming the calculation has optimised to an energy minimum is calulating the vibrations of the molecule. Optimisation changes the molecule until the first derivative of the energy surface equates to zero, therefore a maxima or minima. Vibration calculation takes the second derivative of the energy surface and therefore a positive frequency equates to a energg minimium. Negative frequencies would suggest a incorrect optimisation of the molecule.
The vibration of the BCl3 molecule was similarly calculated on the optimised molecule using the Gaussian program with the same method and basis set (relevant input code can be seen below).
# freq b3lyp/lan12mb geom=connectivity pop=(full,nbo)
The calculation yielded six positive vibrational frequencies (214, 214, 377, 417, 939 and 939 cm-1) similar in nature to that of the BH3.
Discussion
The bond length of 1.87 angstroms is higher than that given in literature of 1.75 angstoms suggesting a no completely accurate optimisation, this can be explain with medium level basis set used, a higher lelvel more accurate basis set may achieve a more accurate geometry at a cost of more computational time. The optimisation and frequency calculation both took 21 seconds representing the simple basis set used in where greater accuracy sets used in publishing can take a number of weeks for calculation.
The visualisation of such bonds in gaussview is dependant on the set bond lengths stored within the software, in some occasions the software will not draw a bond due to this fact that it is not within the length parameters stored, but does not mean lack of a bond.
A bond has been defined in many ways through the progress of science. The first model of a bond was a 2 electrons occupying the space between atoms and was modelled through the valence shell electron pair repulsion theory which was effective in predicting the bonding and shape of many molecules. However the theory failed to describe higher valent compounds and a new theory needed to be developed. The new theory can from quantum mechanics, namely the linear combination of atomic orbitals - in where using linear combination of the atomic orbitals wavefunctions for the hydrogen atom and thus created a new definition of the chemical bond to be the constructive overlap of the atomic orbitals. LCAO has also lead to the density theory which decribes a chemical bond as a higher probability of finding an electron between the atom or ions. With all these theories the true definition of a chemical bond can become complex and thus the best way to decribe a bond it thus the simplest one - a stable attractive association between atoms or ions.
Cis and Trans Isomers of Mo(CO)4L2
In the second year synthesis lab; the complex Mo(CO)4(PPh3)2 was prepared. The structure has two possible geometries of the L ligands; cis or trans. For this exercise L=PCl3 (PPh3 is a very large and will extend computational time, Cl has similar electronic behaviour to Ph so can be used as a appropiate approximation). The complex was modelled using gaussview using the softwares preset bond length and angle parameters and then optimised using the b3lyp method and lan12mb basis set (medium level) to give an initial geometry.
# opt=loose b3lyp/lanl2mb geom=connectivity
The optimisation was set to loose, meaning the optimisation corvergence range is larger, this speeds up the calculation and allows us to get a quick geometry that will take less time to optimise using a more accurate basis set.
The structures can be seen in the jmols below.
The loosely optimised strucutres were then adjusted to the geometries in the picture below.
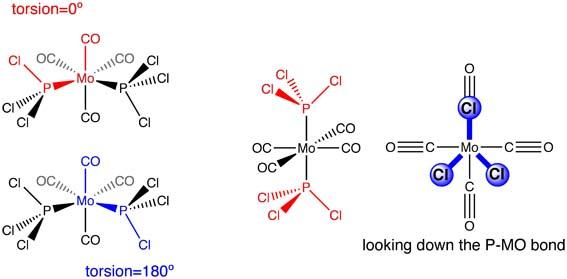
This new geometrical arrangement was then resubmitted for optimisation with the more accurate basis set of lan12dz and very tight criteria to converge to (see input below)
# opt rb3lyp/lanl2dz geom=connectivity int=ultrafine scf=conver=9
The optimised structures can be seen in the Jmols below.
| Molecule | Mo-C Bond length | Mo-P Bond Length | P-Mo-P Bond Angle | C-Mo-C Bond Angle |
|---|---|---|---|---|
| Cis (First Optimisation) | 2.06 angstroms | 2.52 angstroms | 95° | 87° |
| Cis (Second Optimisation) | 2.01, 2.05 angstroms | 2.51 angstroms | 94° | 89° |
| Literature Cis L=PPh3 | 1.97,2.06 angstroms | 2.58 angstroms | 104.6° | 87° |
| Trans (First Optimisation) | 2.11 angstroms | 2.49 angstroms | 180° | 180° |
| Trans (Second Optimisation) | 2.06 angstroms | 2.45 angstroms | 177° | 89° |
| Literature Trans L=PPh3 | 2.01 angstroms | 2.50 angstroms | 105° | 89° |
In comparison to the literature the optimised strucutues the values compare generally well with only a few differences. The longer bonds length seen in the literature could be due to the larger bulky ligand causing greater steric clash and thus lower energy geometry to be further away from the other groups. P-Mo-P bond distance in the optimised structure is far less than in the literature, this agin could be due to the difference in ligand meaning sterics creates a lower energy geometry when the groups are further apart.
Vibrational Analysis
Vibrational analysis of the optimised structure was completed to determine the relative energies of the compounds and to check that the optimised structures are energy minima. Vibrations was calculated using the same method and basis set as in the optimisation (2nd) and same for both isomers - this is essential as basis sets are not compatible as one basis set will approach a model in one way while another will differ. Vibrational input code can be seen below.
# freq rb3lyp/lanl2dz geom=connectivity int=ultrafine scf=conver=9
This was calculated using the high performance computer(HPC)and the vibration both examined in the log file and visualised in gaussview. The vibrational calculation yields six low frequencies, for accuracy purposes it is required these values be close to zero and greater than -5cm-1. These six low frequencies relate to the motion of the nuclei and not the bonds (the -6 in 3n-6) and thus cannot b e modelled graphically.
Below is relevant section of the isomers output file for the low frequency calculations.
Trans
Low frequencies --- -2.1345 -1.5039 -0.0006 -0.0005 0.0003 3.2394
Cis
Low frequencies --- -1.9286 0.0004 0.0004 0.0005 0.9776 1.4007
As can be seen the low frequencies calculated are within the accuracy range and the other vibration are all positive in both structures - therefore confirming correct optimisation energy minima. This conformation comes from the fact that in classical physics frequency is derived from the force constant K. The natural frequency is therefore directly proportional to the second derivative of the potential (0.5KX^2) and thus a positive frequency confirms a minima in the potential.
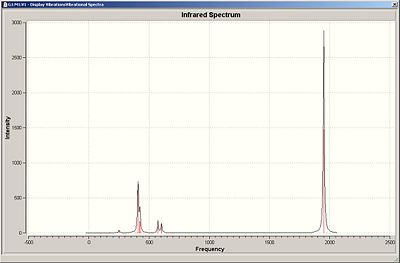
Infrared spectra for the compounds can be seen below.
Trans IR
Cis IR
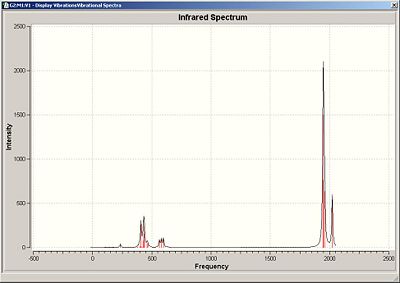
As can be seen in the IR the are only a few IR active vibration in both structure, highest of which is the carbonyl stretches, assigned below. The cis isomer ahs a greater number of peaks with the carbonyl stretches due to its lesser symmetry creating two IR sets of IR active modes.
Trans:
| Frequency/cm-1 | Intensity | Vibration |
|---|---|---|
| 1950 | 1467 | Antisymmetric Stretch |
| 1977 | 0.7 | Asymmetric Stretch |
| 2031 | 3.8 | Symmetric Stretch |
Cis:
| Frequency/cm-1 | Intensity | Vibration |
|---|---|---|
| 1945 | 763 | Asymmetric Stretch |
| 1948 | 1498 | Symmetric Stretch |
| 1958 | 632 | Asymmetric Stretch |
| 2023 | 597 | Symmetric Stretch |
Relative Energies
Trans Isomer:
| Energy/a.u. | Energy/kj/mol-1 |
|---|---|
| -623.594 | -1637249 |
Cis Isomer:
| Energy/a.u. | Energy/kj/mol-1 |
|---|---|
| -623.595 | -1637246 |
The difference in energies between the two structure is very small, however the tran geometry appear to be the most stable structure - probably due to the addition C=O pi* interaction with the d orbital the PCl ligand interacts with creating a lower energy orbital.
output files trans https://www.ch.ic.ac.uk/wiki/index.php/Image:Checkpoint_25448.fchk cis https://www.ch.ic.ac.uk/wiki/index.php/Image:Checkpoint_25449.fchk References
http://pubs.acs.org/doi/pdf/10.1021/ic00131a055 , http://pubs.acs.org/doi/pdf/10.1021/ic00134a075 , http://www.sciencedirect.com/science?_ob=ArticleURL&_udi=B6TG5-3S9DKVH-V&_user=217827&_rdoc=1&_fmt=&_orig=search&_sort=d&_docanchor=&view=c&_acct=C000011279&_version=1&_urlVersion=0&_userid=217827&md5=b17d462536220bf19fdbb1c116308443
Miniproject
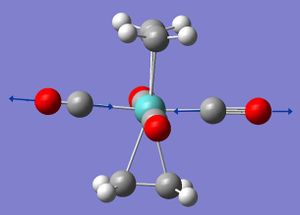
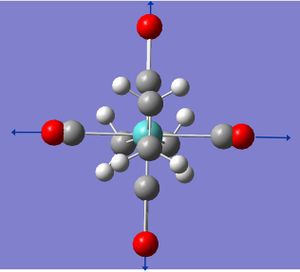
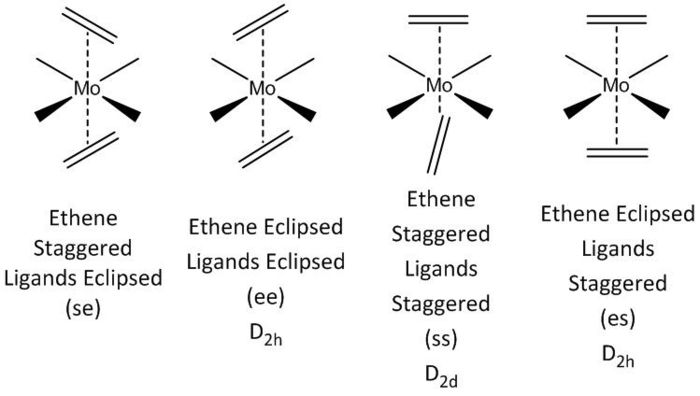
This project will model the nature of the alkene ligand bonding to a metal in a metal complex containing two trans-olenfinic ligands. The modelled compound is that of Mo(C2H4)2(CO)4. Trans olefinic ligands in pseudo octahedral such as the modelled compound can be either eclipsed or staggered to each other as well as either eclipsed or stagger to the other ligands, giving rise to the four possible arrangements (see below). Through geometry optimisation and molecular orbital visualisation the bonding nature of the alkene ligands will be probed and relative stabilities of each arrangment explained.
Optimisation
All the arrangements of the molecules decribed were modelled using the Gaussview software with the assumed square planar arrangement of the carbonyl ligands (as seen in Mo(PPh3)4(C2H4) Reference 1) and literature bond length of the C=C of 1.34 angstroms and bond angle of 120° (normal sp2 carbon bond angle) for both olefinic ligands. Geometry optimisation was achieved through energy minimisation using Gaussian software with the B31YP method and the basis set of LanL2DZ (see relevant section of input file below). Initial optimisation of all structures yielded the se structure above showing the staggered eclipsed structure to be the most stable. To achieve optimised structures for the ee, ss and es arrangements the structures were constrained to their repective point group prior to optimisation. Below is the optimised structures of the four arrangements below.
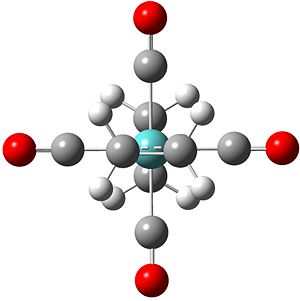
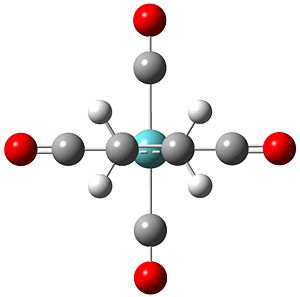
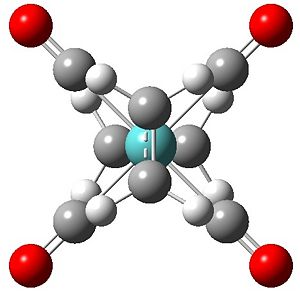
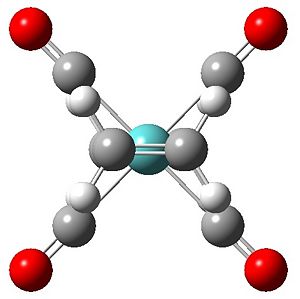
Output Files se DOI:10042/to-4662 ee DOI:10042/to-4663 ss DOI:10042/to-4664 se DOI:10042/to-4665
Initial Observations
Compared to free ethene the complexed alkene has carbon hydrogen bonds which are no longer planar with the carbons and have a bond angle of 115° (lit. usually 120° sp2 carbon and 109° sp3 carbon). The carbon carbon bond length is now a longer 1.40 angstroms (lit. 1.34 angstroms ethene, 1.54 angstroms ethane) all suggesting carbon hybridisation of somewhere between sp2 and sp3 and thus being complexed has destabilised the pi bond. This can be explained through the metal back donating into the pi* orbital of the alkene, destabilising the pi bond.
This hybridisation is reflected in the natural bond orbital analysis for the se structure C-H bond below with the carbon having approximately 1:2.5 ratio of s:p thus in between sp2 and sp3.
---------------------------------------------------------------------------------
    22. (1.97254) BD ( 1) C  10 - H  18
                 ( 61.86%)   0.7865* C  10 s( 27.61%)p 2.62( 72.39%)
                                             0.0008 -0.5255  0.0032  0.8071 -0.0035
                                             0.1809  0.0190  0.1972 -0.0209
                 ( 38.14%)   0.6176* H  18 s(100.00%)
                                            -1.0000 -0.0029
In the staggered elipsed structure the M-CO bonds are orientated slightly away from the eclipsed alkene and perphaps suggesting a steric interaction between the alkene and the carbonyl ligands - maybe a possible reason for the se being more stable than the ee structure where this steric clash reducing orientation is not possible.
Ethene Bonding Modes
The molecular orbitals of the se structure was calulated with the optimisation procedure and visualised on gaussview. Through said visualisation the molecular orbitals their component orbitals can be postulated and using the literature energy levels for the Mo(CO)4 and ethene - a simplified molecular orbital diagram can be generated (see below).
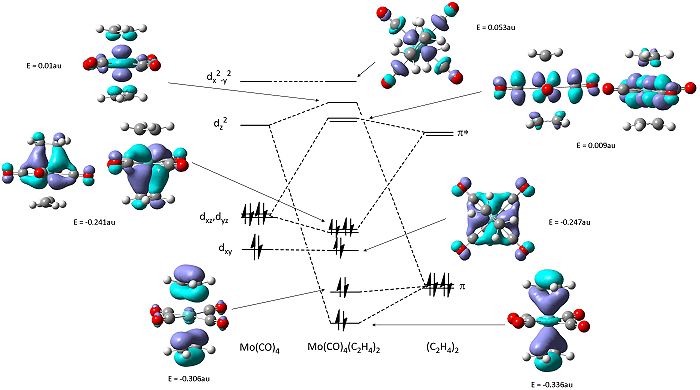
The molecular orbitals shows two modes of bonding of the ethene with the metal tetracarbonyl centre: both pi orbitals overlaping with dz2 and the each pi* orbital overlapping with either the dxz or dyz.
Relative Energies
| Molecule | Energy/a.u. | Relative Energy/kcal/mol |
|---|---|---|
| se | -677.939636 | 0 |
| ee | -677.928681 | 7 |
| ss | -677.929671 | 6 |
| es | -677.922219 | 11 |
From the relative energies of the molecules shows as the optimisation shows the most stable structure is the se arrangement. Apart from less sterical clash described earlier to look at the reasoning for these difference in energies between arrangement the molecular orbital arrangement will be probed.
Molecular Orbitals Comparison
Ethene Staggered
First to be probed is the seen more stable structure when the alkenes are staggered to each other. Therefore the molecular orbitals will be visualised for both the se and ee structures and compared (ignoring ligand interactions at this point)
Both structures show the interaction of the pi orbtials from both alkenes donating into the metal dz2 orbtial (seen below) at the HOMO-4. This molecular orbital in the ee structure extends in planar manner between the two eclipsed alkene resulting in the lower relative energy of the orbtial than in the se where extension involves a twist due to the staggered arrangement, suggesting gain in stability in this orbital for the ee arrangement relative to the se of 0.01 au.
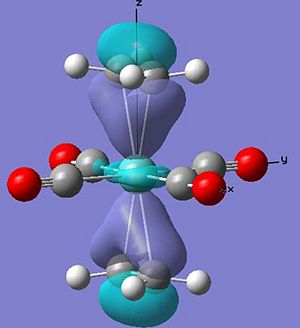
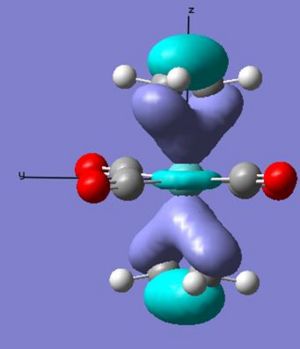
The main difference between the arrangements can be seen in the interaction of the pi* orbital with the d orbitals on the metal (as seen earlier in the change in ethene bond length and angles). In the ee arrangement this interaction appears at the HOMO-2 (-0.245au) in where both alkenes pi antibonding orbitals overlap with the dxz orbital on the metal leaving the dyz of wrong orientation as the HOMO (-0.216au). While in the se arrangement the staggered arrangement of the alkenes creates two degenerate pi* overlaps with the metal d orbitals at the HOMO (-0.241). Therefore a gain in stability for the se arrangement relative to the ee of 0.044 au [(4 x -0.241) - ((2 x - 0.216)+(2x -0.245))].
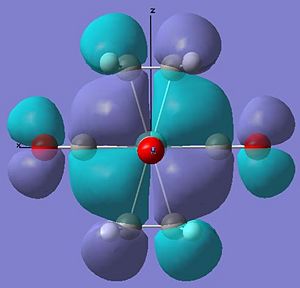

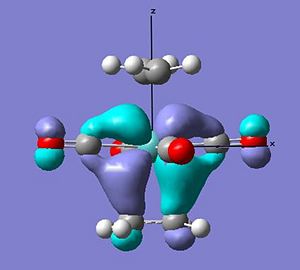
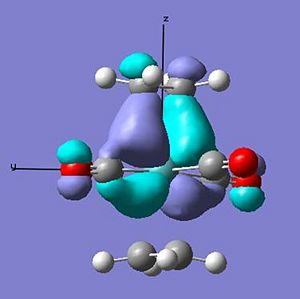
These differences account for a stabilisation of the -0.034 au of the se over the ee arrangement - which is larger than that calculated. This can be explained through the planar nature of the lower lying orbitals created in the ee arrangment that cause some stabilisation.
Eclipsed to the Ligands
From the relative energies it also appears that a eclipsed arrangement to the ligands is more stable than the staggered alternative. Comparing the calculated MOs for the ss arrangement to the more stable se, the reason for the stabilty can be looked at.
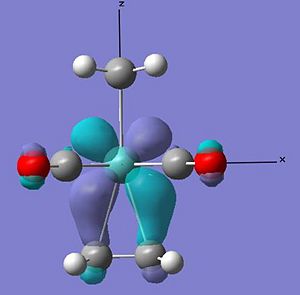
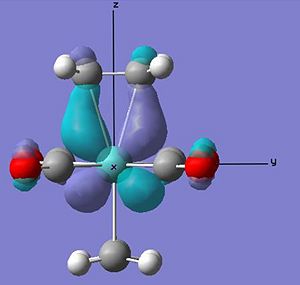


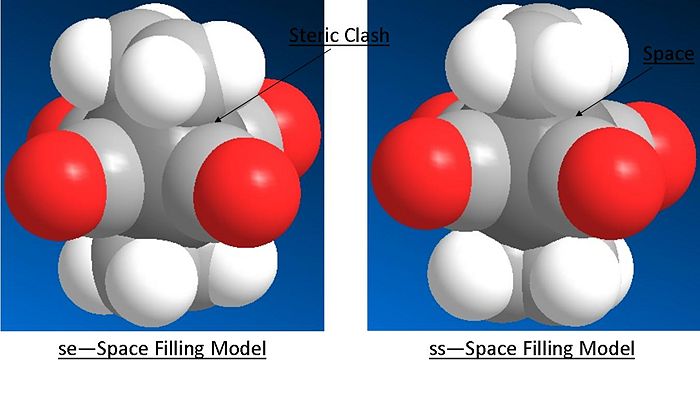
From the above HOMO orbitals for both arrangements it can be seen in the se arrangement that the d orbtials donating into the pi* orbtial of the alkene is also overlaping with the carbonyl ligands pi* orbital - overall creating a lower energy orbital. Whilst in the ss orbital the staggered arrangement of the alkene to the carbonyl ligands means that their pi* is not in the correct orientation to overlap with the same d orbital as the alkene pi*. This equates to a stabilisation of the se relative to the ss of 0.036 au. This is again larger than that calculated, however the staggered nature of the ligands to the alkenes is likely to have less steric clash than the eclipsed arrangement accounting for some relative stabilisation. As can be seen in the space filling model of the optimised compounds below.
Adjusting the Ethene Ligands
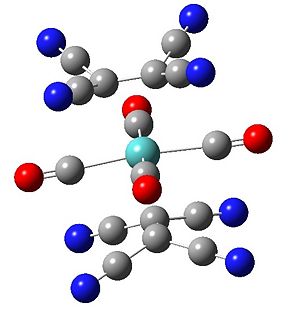
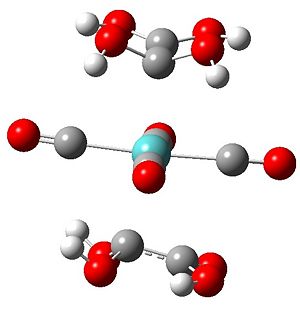
The interaction of the ethene pi and pi* orbitals with the metals d orbitals is dependant on the energy differences between the orbtials - by changing the side groups on the ethene - the pi and pi* orbitals can be changed and resulting molecular orbtial change probed. The sides groups on the ethene was changed from C2H4 to have the electron withdrawing cyano groups attached to have structure C2(CN)4 and the electron donating hydroxyl groups to have structure C2(OH)4.
Hydroxyl Substituted Olefinic Ligands - Molecule 6
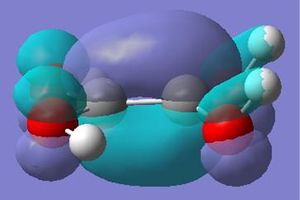
The complex 6 the alkene is no longer orientated parallel to the carbonyl ligands with one carbon closer to the metal centre. From the molecular orbtials calulation and visualisation it appear it is now more favourable for one of the pi bonding orbitals to twist and overlap with the dxz (HOMO-3) creating this difference in orientation relative to the ligands (also creating an antibonding arrangement higher in energy, thus removing one energy level). This twist also means that the dyz only overlaps with one of the lobes of the pi* orbital (HOMO-1) making the interaction less favourable. The remaining two electrons (from the removed orbital) are now in previously unoccupied dx2-y2 orbitals (now in correct orientation) overlaping with the remaining pi* orbital (HOMO).
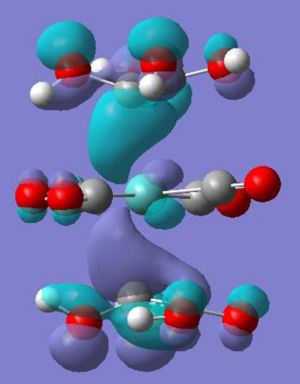
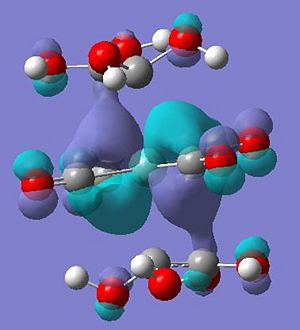
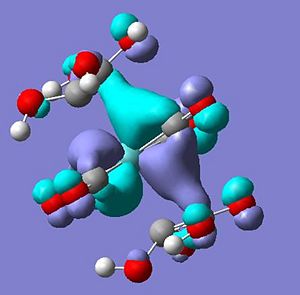
From this it can be postulated that the energies of the alkene ligand orbitals interactions have been significantly changed, through modelling both the ethene and tetrahydroxylethene (modelled through gaussview and optimised with same method and basis set) - some questions can be answer to how the energies of the orbitals have changed. Below is a table to show how the molecular orbitals have changed between the two different ligands.
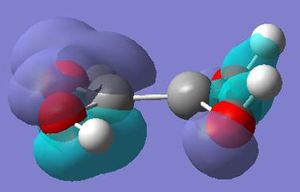
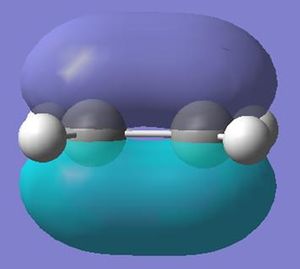
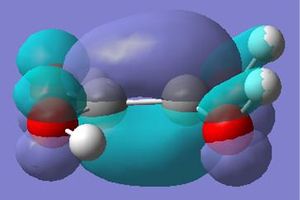
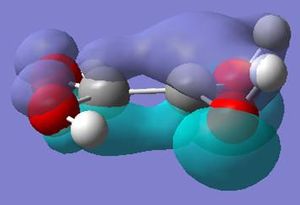
As can be seen the two lone pairs found in oxygens p orbitals interact with the HOMO and LUMO of the ethene ligand creating four new orbitals - a pi and pi* with lower energy than in ethane and a pi and pi* with higher energy than ethene. Therefore this higher energy pi orbital is now closer in energy to the dxz of the molybdenum tetracarbonyl and the higher energy pi* closer to the unoccupied dx2-y2 - explaining observations seen.
Cyano Substituted Olefinic Ligands - Molecule 5
Visually the ligand appears to be in the same arrangement - se with and without the cyano withdrawing groups on the alkenes, however when looking at the molecular orbitals differences have occured. Compared to the se structure where has two degenerate HOMOS: one of the staggered alkenes pi* orbitals overlap with the dxz and the other pi* orbital overlaped with the dyz, molecule 5 has two degenerate HOMO-1 orbitals where in both pi* orbitals interact with either the dxz or dyz involving a twist in the orbital. The HOMO-4 orbital is of the same nature as the se (pi bonding overlapping with dz2 orbital of the metal centre) but at a slightly larger energy of -0.337au (compared to -0.341au)
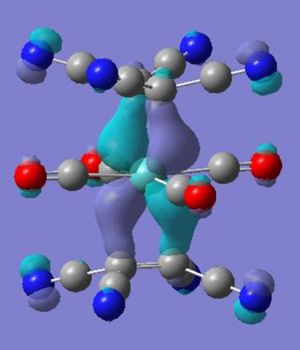
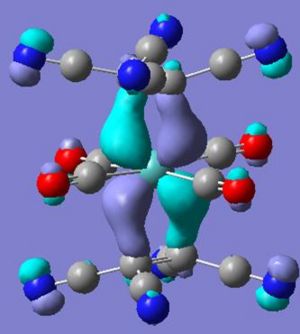
Again through looking at the difference in the ligands unsubstituted the change in the molecular orbitals of the complex relative to the se structure can be probed. Below is a comparison in the orbitals between the tetracyanoethene and ethene.
From the above orbital difference the pi* orbitals of the alkenes are now lower in energy - making them closer to the dxz and dyz in the metal centre of complex 5, this may be used to explain the twist through the smaller energy difference creates a greater stablisation if the seen twist occurs. The HOMO-4 energy difference between se and molecule 5 is explained through the destructive overlap between the C=C pi orbital and the CN pi* - raising its energy and thus less stabilisation when overlaped with the metals dz2 orbital. The apparent donation of the electron in to the CN pi anti bond is seen in molecule 5 with a CN bond length of 1.18 angstroms and CCN bond angle of 178° smaller than the usual 1.136 angstroms and 180°.
Ethyne Ligands - Molecule 7
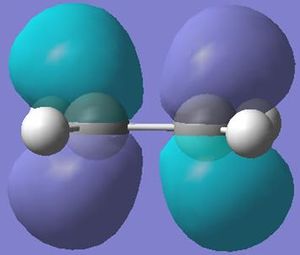
To look further into the pi interaction with the d orbitals on the molybdenum tetracarbonyl centre, the ligand was altered to ethyne that contains two pi bonds perpendicular from each other to give molecule 7 below. The structure was modelled using Gaussview and optimised using gaussian software (same method and basis set).
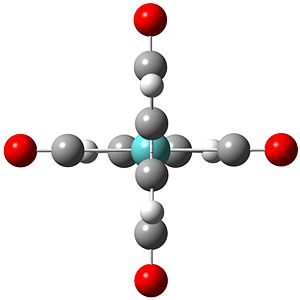
The structure optimised to a structure in where the ethyne ligands are staggered to each other and both eclipsed to the carbonyl groups - matching that of the most stable se structure seen with the ethene ligands - most probably for the same reasons. The donation of the metals d orbitals into the ethynes pi* orbitals is evident like ethene through the longer bond length of 1.3 angstroms (usually 1.2 angstroms for uncomplexed ethyne) and a CCH bond angle of 150° compared to the expected 180° for a usual sp hybridised carbon. The donation into the pi* orbital of the ethyne (as in the ethene ligand) has created a hybridisation somewhere between sp and sp2.
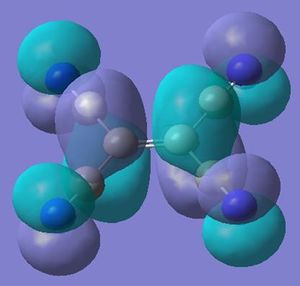
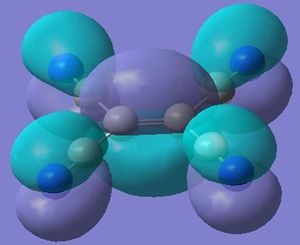
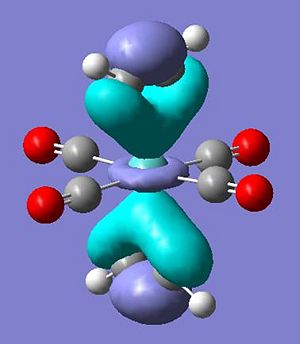
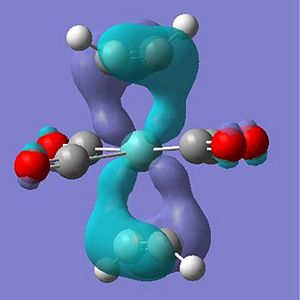
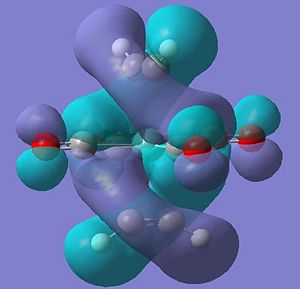
The occupied molecular orbitals of molecule 7 are different due to this extra pi and pi* orbital in the ligand. The complex has the same pi overlap with metal centre's dz2 at HOMO-5. The remaining pi orbitals (orientated perpendicular to the other pi orbtial) overlaps with the dxy and dyx orbitals at HOMO-4 . The pi* orbitals interact in a very odd manner in where the d orbtial overlaps with the two perpendicular pi* orbitals at the same time to create two seamingly helixical molecular orbitals at the HOMO (see pictures below) - this arrangement of the orbitals is only availible in the staggered arrangement of the ethyne ligand suggesting a possible reason for the greater stabilisation.
Output Files
Molecule 5 DOI:10042/to-4666 Molecule 6 DOI:10042/to-4667 Molecule 7 DOI:10042/to-4668
Vibrational Analysis
As mentioned earlier through vibrational analysis of the molecule can check whether the optimsation is successfully reached an energy minimum. The vibrations were calculated using gaussian on the optimised structures (relevant part of input file below).
# freq rb3lyp/lanl2dz geom=connectivity int=ultrafine scf=conver=9
The vibration for the most stable arrangement se showed a total of 57 vibration all positive - showing energy minima and thus correct optimised geometry. Out of the 57 vibration only 1 stretches showed significant IR intensity (only to create large change in dipole moment) - the carbonyl ligands assymmetric stretch. There are three carbonyl stretches vibration corresponding to the assymmetric stetches, the antisymmetric stretch and the fully symmetric stretch. Below is a table for the ligand stretches only.
The carbonyl stretches appear within the range expected for a carbonyl ligand of 2130 – 1700 cm-1 (IR active only). The carbon carbon double bond stretch in ethene was calculated to be at also shows such 1633cm-1 (using Gaussian and same method and basis set) with a IR intensity of zero. The lower symmetry of the se complex makes the C=C stretches slightly change the dipole moment allowing from some IR intensity, the lower value of again indiciative of the back bonding of the filled metals d orbitals into the pi* of the ethene seen earlier (destabilising the bond, lower energy to distort).
| Vibration | se | ee | ss | es | Molecule 5 (CN) | Molecule 6 (OH) |
|---|---|---|---|---|---|---|
| Carbonyl Assymmetric Stretch | 1894 cm-1 | 1891 cm-1 | 1887 cm-1 | 1870 cm-1 | 2008 cm-1 | 1810 cm-1 |
| C=C Stretch | 1553 cm-1 | 1579 cm-1 | 1565 cm-1 | 1586 cm-1 | 1345 cm-1 | 1509 cm-1 |
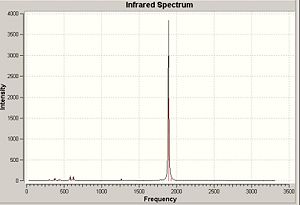
The carbonyl stretches appear to be largest (less amount of back bonding into their pi*) when the ethene ligands are eclipsed to them, as seen earlier in the eclipsed structures the C=O pi* in the eclipsed structures is overlapping with the same d ortbital as the C=C pi* thus the electron density is spread further and therefore lowering the back bonding to the carbonyl. The C=C stretch seem to be largest wavenumber when the ethene are eclipsed to each other, in this case both ethene pi* orbital overlap with the same d orbital - spreading the electron density and reducing back bonding. The lower wavenumber carbonyl and C=C stretches in molecule 6 can be explained through the electron donating OH group into the pi* of the C=C (destabilising the bond) therefore inscreasing electron density in the orbital - increasing backbonding to the carbonyl. In molecule 5; the electron withdrawing CN removes electron density from the C=C pi* orbital (destabilising the bond, decreasing wavenumber of stretch) and therefore removing electron density from the metal centre for backbonding into the CO pi* (increasing the stretches wavenumber).
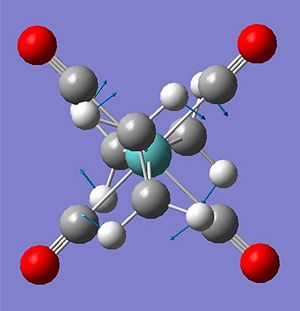
The arrangements: ee ss and es all showed negative wavenumber vibrations (-45, -110,-136 cm-1 respectfully) through calculation - this could suggest improper optimised structures, however the optimisation did sucessfully converge and it is already known that the structures named are not the most stable and restricted in the manner they are. The imaginary vibration corresponds to the ethenes twist relative to each other (see below) suggesting these arrangement are transitional states to the more stable se structure.
(vibrational data can be found in output files for the molcules cited previously)
Conclusion
The miniproject was successful in confirming and explaining the most stable arrangement of the complex of staggered eclipsed. The bonding of the ethene ligands to the metal was succesfully probed. Changes to the structure were completed and the effects looked at and explained. Further investigation will see the effect of adding electron withdrawing groups to the ethyne ligand to see how this alters the molecular orbital observed.
References
http://pubs.acs.org/doi/abs/10.1021/ja00476a017 N. Rosch and R. Hoffmann, Inorg. Chem., 13, 2656 (1974). Handbook of Chemistry & Physics 65th Edition CRC Press

