AndrewBulata01520703
Molecular Reaction Dynamics
Introduction
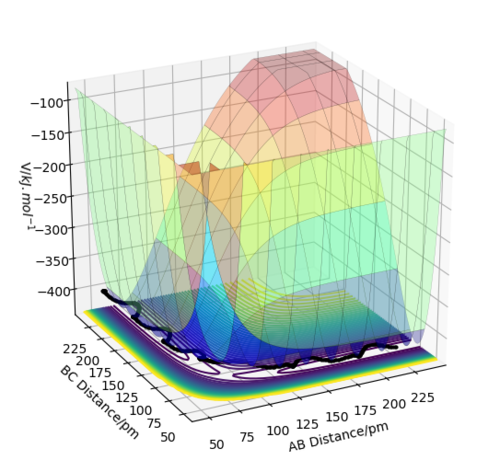
On a potential energy surface diagram, the positions of interest are the transition state (TS), corresponding to a maximum on the lowest energy path connecting the reactants and products, reactants/products corresponding to a minimum and intermediates, if they exist, which generally occupy shallow wells. Mathematically, on a potential energy surface, the transition state is a saddle point. At this point, the gradient of the potential energy vanishes and the Hessian matrix has both positive and negative eigenvalues.
Good but more explanation is needed on what the Hessian matrix is and how can you distinguish the TS from the local minimum? Sf3014 (talk) 21:43, 21 May 2020 (BST)
In the following simulations, the angle of collision was set to 180 degrees.
Trajectories from r1 = r2: locating the transition state
In the case of the reaction
HA-HB + HC → HA + HB-HC
the transition state is symmetric, so r1 = r2. When the transition state is achieved, the gradient of the potential energy is 0, but the components of the gradient are the forces acting along each coordinate. So, a vanishing gradient implies a vanishing force system. The geometry of the transition state can be found modifying the common value of the distances until the forces are equal to 0. The value of rTS was found to be 90.775 pm. Figure 2 shows a plot of internuclear distance vs. time when r1 = r2 and p1 = p2 = 0 g mol-1 pm fs-1.
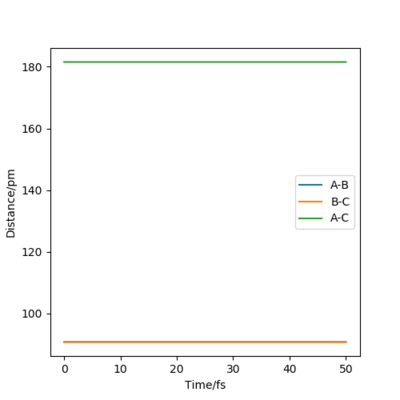
As it can be seen, the values of the distances do not fluctuate anymore, which means that the TS has been achieved.
Good description. You can make your point clear by zooming in on the position for the TS on your distance vs time graph Sf3014 (talk) 21:48, 21 May 2020 (BST)
Trajectories from rAB = rTS + δ, rBC = rTS
MEP shows the minimum energy path that does not take vibrational energy into account. Along the MEP, the system has no kinetic energy. Therefore, the trajectory of the reaction on the contour plot for MEP calculation does not oscillate, while the trajectory for a dynamics calculation is a wiggly line (it oscillates).
Yes there is no vibrational factor for the mep calculation but there is no evidence to show no kinetic energy because the atom still moves Sf3014 (talk) 21:54, 21 May 2020 (BST)
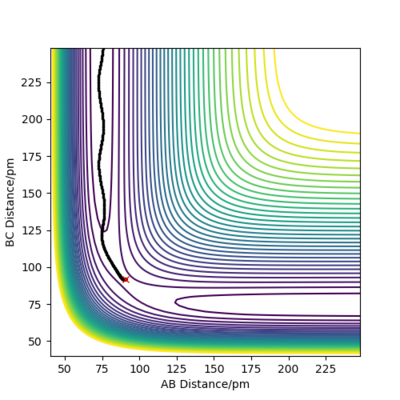
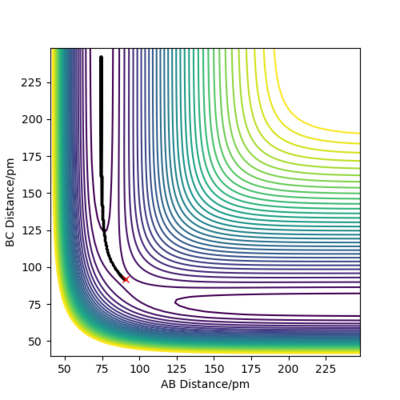
Trajectories from rAB = rTS, rBC = rTS + δ
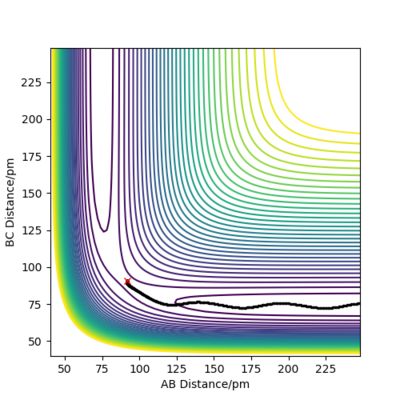
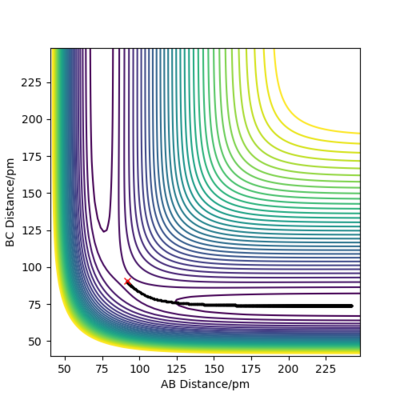
Reactive and unreactive trajectories
For the table below, the following reaction is discussed:
HA-HB + HC → HA + HB-HC
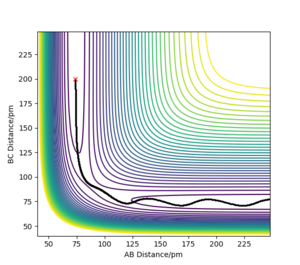
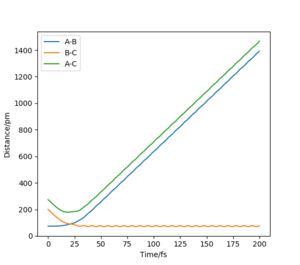
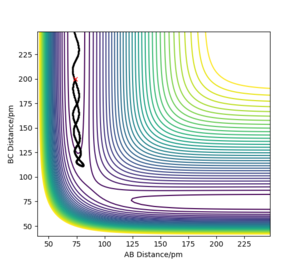
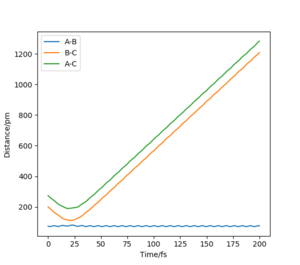
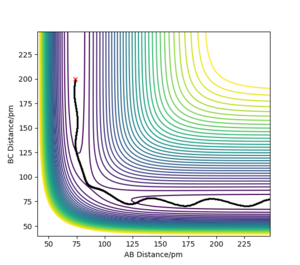
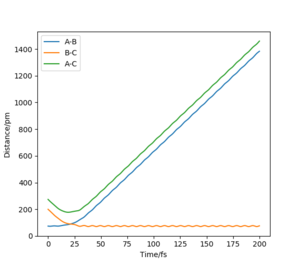
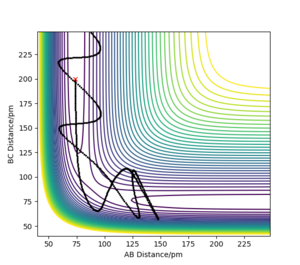
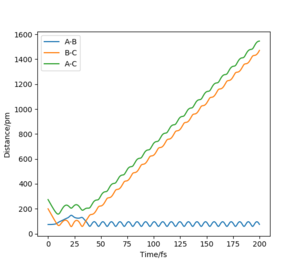
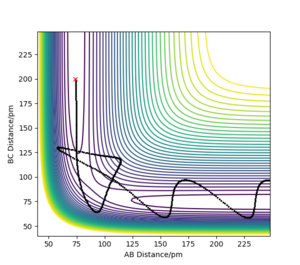
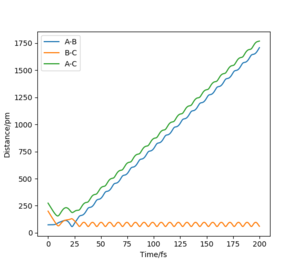
I will be referring to HA as atom A and so on. I have chosen to also include plots of internuclear distances vs time to better illustrate my discussion. The initial conditions for the distances were set to be rAB = 74 pm and rBC = 200 pm.
Good descriptions Sf3014 (talk) 21:58, 21 May 2020 (BST)
Transition State Theory vs experimental results
In the simulations conducted above, there are instances where barrier recrossing occurs. One of the main assumptions of TST is that barrier recrossing cannot happen. Therefore, there is a contradiction between TST and experimental results.
Is this your conclusion to the graph above? If yes this is not clear. Where did you get your TST assumption from? References would be good. How will this TST assumption affect the rate of the reaction in comparison to experimental values? Also, for good practice, always define the abbreviation before using it, e.g. transition state theory (TST) Sf3014 (talk) 22:05, 21 May 2020 (BST)
F-H-H system
For the discussion below, the following reactions are considered:
H-H + F → H + H-F
and
F-H + H → F + H-H
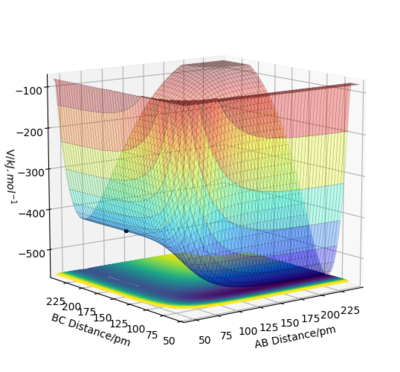
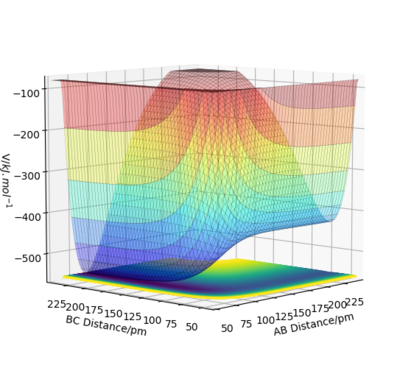
From the potential energy surface plots above, it can be concluded that the first reaction is exothermic (because the potential energy of the reactants is higher than that of the products) and the second reaction is endothermic (because the potential energy of the reactants is lower than that of the products). The bond strength of H-F bond is greater than the bond strength of H-H. This is why the first reaction is exothermic and the second is endothermic.
Good. It will be clearer if you referred to your plots by their figure numbers and mention the reaction in your description as well as in your figure caption. Also, bond strengths can be verified by published experimental values. This can be support your findings. Sf3014 (talk) 22:20, 21 May 2020 (BST)
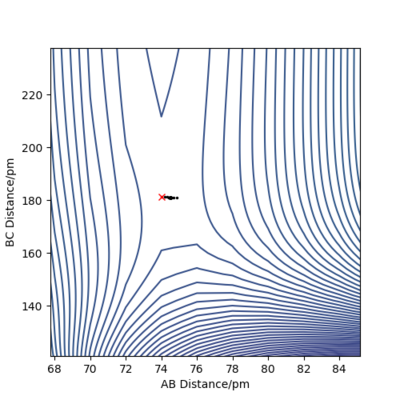
The transition state for both reactions is the same because one reaction is the reverse of the other. Knowing that the TS is a saddle point, it can be found from a contour plot as a point outside the curvature of all the contour lines. The following figure illustrates this argument.
To refine the search, one modifies the starting point of the MEP branch in an attempt to bracket a point of direction change. Figures 10 and 11 illustrate this method.
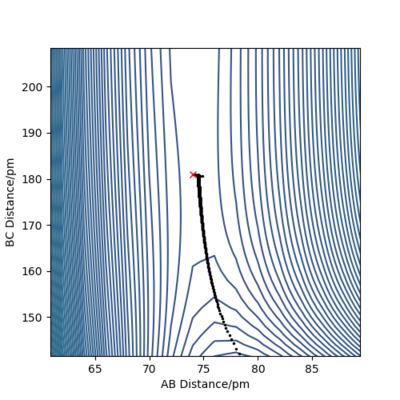
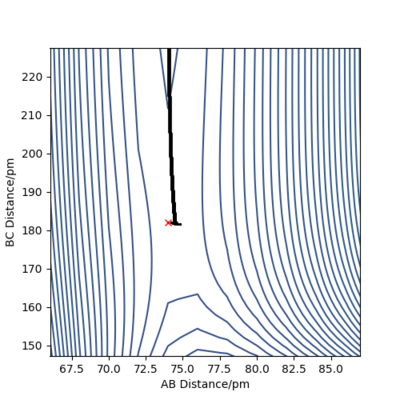
Thus, the position of the TS was approximated to be rAB = 74 pm and rBC = 181.35 pm.
To determine the activation energies of the two reactions, one must analyse the plots of energy vs time along the MEP. Figures 12 and 13 show the plots of potential energy vs time for the first and second reaction.
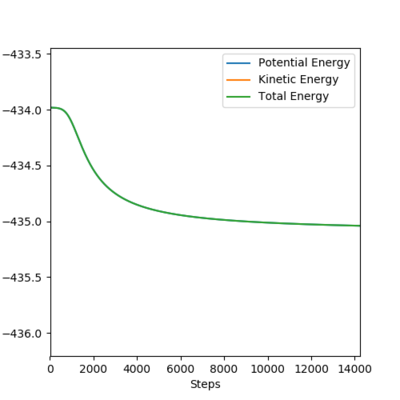

Thus, the activation energy for both reactions was calculated as the difference between the plateaux associated with the TS and the reactants in this order.
The activation energy for the first reaction is approximately 1 kJ/mol, while the activation energy for the second reaction is about 126 kJ/mol.
Good but you could be more accurate in activation energy for your exothermic reaction, like to 3 s.f Sf3014 (talk) 22:20, 21 May 2020 (BST)
Reaction dynamics
For the reaction
H-H + F → H + H-F
a reactive trajectory can be found starting from:
rAB = 74 pm
rBC = 300 pm
pAB = 0.2 g mol-1 pm fs-1
pBC = -3.5 g mol-1 pm fs-1.
Figure 14 proves this trajectory is reactive.
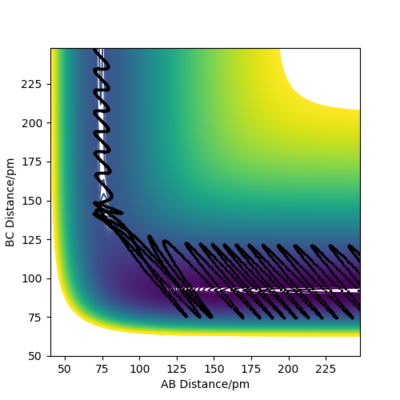
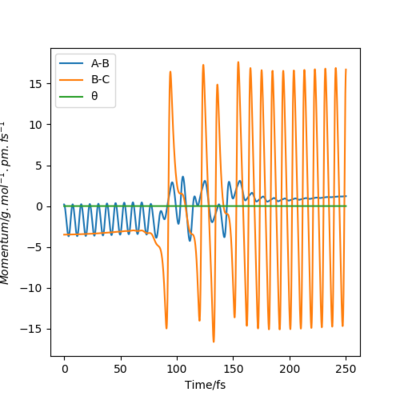
For every reaction, the total energy of the atoms is conserved. From the momenta vs time plot (see figure 15), it can be seen that after passing the TS, the momentum of the HF molecule oscillates with a very large amplitude, which suggests that the reaction energy is released as vibrational energy of the H-F bond.
Good but how can you measure this experimentally? Sf3014 (talk) 22:25, 21 May 2020 (BST)
Polanyi's rules
The following experiments that I have conducted illustrate Polanyi's empirical rules. These rules state that vibrational energy is more efficient than translational energy in activating a late barrier reaction, while the reverse is true for an early barrier reaction. Of the reactions I have considered, which are
H-H + F → H + H-F
and
F-H + H → F + H-H
the first one exhibits an early transition state and the second one exhibits a late transition state. For each, I have set up simulations starting from high vibrational and low translational energy and low vibrational and high translational energy respectively while keeping the kinetic energy of the initial state above the activation energy.
H-H + F → H + H-F
Figures 16 and 17 present trajectories based on an initial state with low translational and high vibrational energy, and high translational and low vibrational energy respectively.
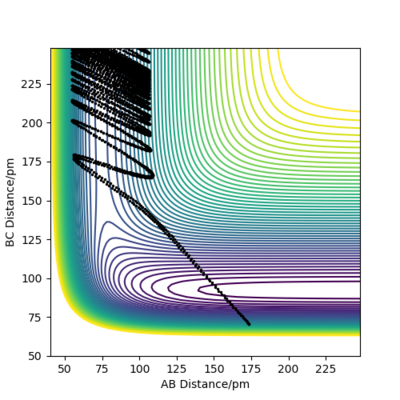
Initial state for figure 16:
rAB = 74 pm
rBC =250 pm
pAB = -10.0 g mol-1 pm fs-1
pBC = -0.2 g mol-1 pm fs-1
Kinetic Energy = 98.021 kJ mol-1
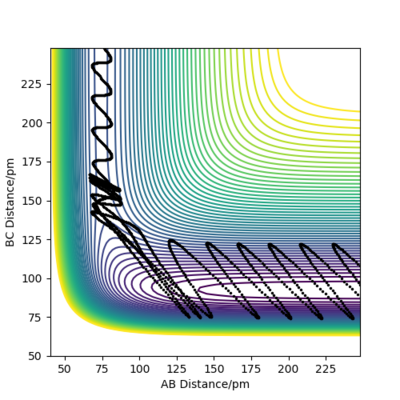
Initial state for figure 17:
rAB = 74 pm
rBC =250 pm
pAB = 0.1 g mol-1 pm fs-1
pBC = -5.0 g mol-1 pm fs-1
Kinetic Energy = 13.668 kJ mol-1
In both cases, the kinetic energy of the initial state is well above the activation energy. However, the distribution of vibrational and translational energy is significantly different. As it can be seen, starting from an initial state of high vibrational energy (high pAB) and low translational energy (low pBC), one gets a non-reactive trajectory. On the other hand, starting from an initial state of low vibrational and high translational energy gives a reactive trajectory.
F-H + H → F + H-H
Figures 18 and 19 present trajectories based on an initial state with low translational and high vibrational energy, and high translational and low vibrational energy respectively.
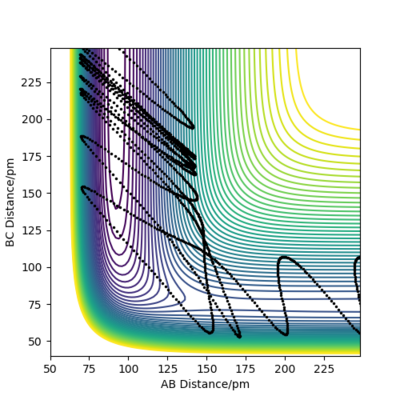
Initial state for figure 18:
rAB = 74 pm
rBC =250 pm
pAB = 20.0 g mol-1 pm fs-1
pBC = -2.0 g mol-1 pm fs-1
Kinetic Energy = 254.526 kJ mol-1
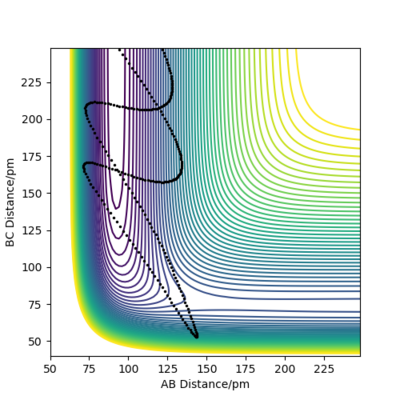
Initial state for figure 19:
rAB = 74 pm
rBC =250 pm
pAB = 10.0 g mol-1 pm fs-1
pBC = -10.5 g mol-1 pm fs-1
Kinetic Energy = 267.882 kJ mol-1
In both cases, the kinetic energy of the initial state is well above the activation energy. However, the distribution of vibrational and translational energy is significantly different. As it can be seen, starting from an initial state of high vibrational (high pAB) and low translational energy (low pBC), one gets a reactive trajectory. On the other hand, starting from an initial state of low vibrational and high translational energy gives a non-reactive trajectory.
Taken together, all these results provide an illustration of Polanyi's empirical rules on reaction activation efficiency.
Good effort. In some cases it isn't clear what A, B and C is because the trajectories come off the plot at both ends of the reaction path with takes away from your description. The reader shouldn't have to work so hard to understand what you are saying Sf3014 (talk) 22:38, 21 May 2020 (BST)

