All Hail The Return Of GaussView
Introduction
GaussView makes its much anticipated return in 2018 with its biggest assignment yet...
Ng611 (talk) 15:09, 31 May 2018 (BST) Nice... A brief introduction to the theory/rationale behind your experiment would be even better though ;)
EX3
BH3
B3LYP/6-31G level
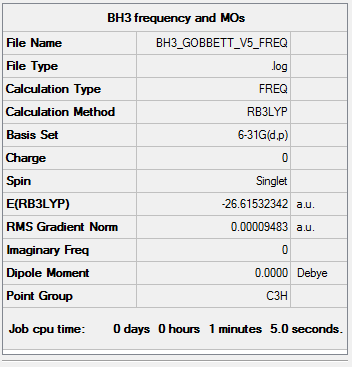
The following BH3 molecule was optimised. The optimisation was then checked by frequency and vibrational analysis.
Item               Value     Threshold  Converged?
 Maximum Force            0.000190     0.000450     YES
 RMS     Force            0.000095     0.000300     YES
 Maximum Displacement     0.000747     0.001800     YES
 RMS     Displacement     0.000374     0.001200     YES
 Low frequencies ---   -0.2260   -0.1035   -0.0054   48.0278   49.0875   49.0880
 Low frequencies --- 1163.7224 1213.6715 1213.6741
Click this link for the full .log file
BH3 |
Vibrational Analysis
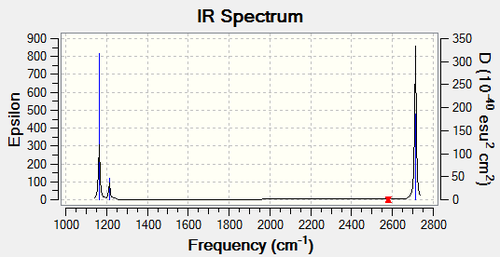
| Frequency (cm1) | Intensity (arbitrary units) | Symmetry | IR Active? | Type |
|---|---|---|---|---|
| 1163 | 92 | A2" | Yes | Out-of-Plane Bend |
| 1213 | 14 | E' | Very Slight | Bend |
| 1213 | 14 | E' | Very Slight | Bend |
| 2579 | 0 | A1' | No | Symmetric Stretch |
| 2712 | 126 | E' | Yes | Asymmetric Stretch |
| 2712 | 126 | E' | Yes | Asymmetric Stretch |
The IR spectrum shows three peaks, even though there are six vibrations. There are two reasons for this. Firstly, as the Symmetric Stretch (2579cm1) has no dipole moment, it does not show up on the IR spectrum as it is not IR active. Secondly, there are also two sets of degenerate vibrations: the Asymmetric Stretches (2712cm1) and the Bends (1213cm1). As they have the same frequency, their peaks overlap and appear as one.
MO Analysis
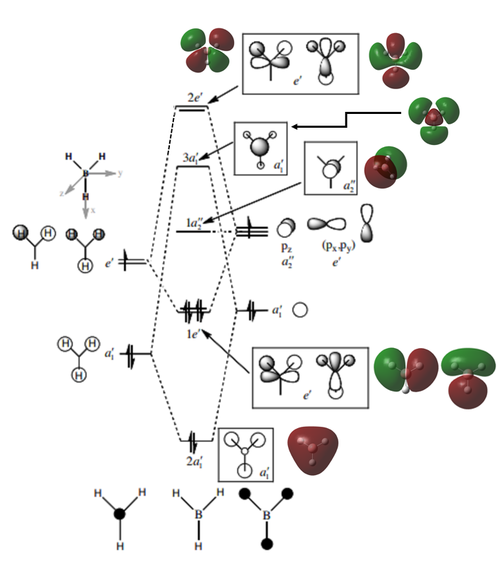
[REF: Basis MO Diagram courtesy of P. Hunt, Lecture 4 Tutorial Problem Model Answers, Can be accessed here: [1] (Accessed: 17/5/18)]
Here, the MO diagram clearly shows the difference between calculated MOs and LCAOs. Broadly speaking, the calculated MOs support the shape predicted by the LCAOs, but more effectively show the electron distribution and size of the orbitals. The calculated MOs also clearly show how higher MOs are increasingly diffuse; something that is not shown by the LCAO models.
NH3
B3LYP/6-31G (d,p)
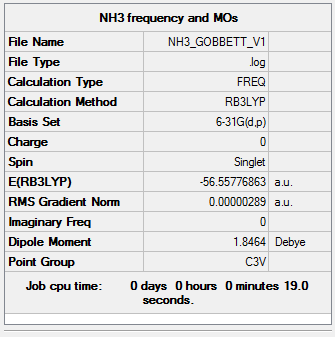
The following NH3 molecule was optimised. The optimisation was then checked by frequency analysis.
Item               Value     Threshold  Converged?
 Maximum Force            0.000005     0.000450     YES
 RMS     Force            0.000003     0.000300     YES
 Maximum Displacement     0.000012     0.001800     YES
 RMS     Displacement     0.000008     0.001200     YES
 Low frequencies ---  -11.5223  -11.4866   -0.0030    0.0246    0.1415   25.6160
 Low frequencies --- 1089.6618 1694.1735 1694.1738
Click this link for the full .log file
Ng611 (talk) 15:12, 31 May 2018 (BST) Was this a pure frequency calculation or an opt+freq calculation? You should try to perform different types of calculations separately where possible.
NH3 |
NH3BH3
B3LYP/6-31G (d,p)
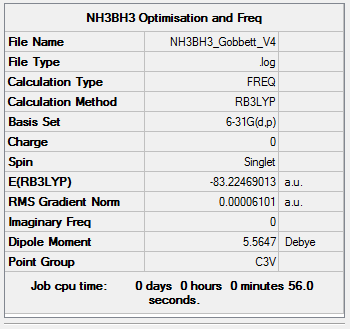
The following NH3BH3 molecule was optimised. The optimisation was then checked by frequency analysis.
Item               Value     Threshold  Converged?
 Maximum Force            0.000123     0.000450     YES
 RMS     Force            0.000057     0.000300     YES
 Maximum Displacement     0.000523     0.001800     YES
 RMS     Displacement     0.000287     0.001200     YES
 Low frequencies ---   -0.0614   -0.0463   -0.0066   21.3815   21.3876   40.8513
 Low frequencies ---  266.0674  632.3620  640.1229
Click this link for the full .log file
NH3BH3 |
Energy Calculations
| E(BH3) | E(NH3) | E(NH3BH3) |
|---|---|---|
| -26.61532342 | -56.55776863 | -83.22469013 |
ΔE=E(NH3BH3)-[E(NH3)+E(BH3)]
 = -83.22469013 - [(-56.55776863) + (-26.61532342)]
 = -0.05159808 a.u.
The method of calculation we use is accurate to approx. 5 kJmol-1, but due to systematic errors we assume it is acceptable to report comparative values to the nearest 1 kJmol-1,. This translates as 0.00038 a.u.
 = -0.05160 a.u.
 = -135 kJmol-1
Thus, the dative bond energy for the BH3-NH3 molecule has an associative value of -135 kJmol-1. Hence, the dissociative bond energy is 135 kJmol-1. This makes it a comparatively weak bond {REF: C-C = 348 kJmol-1, H-H = 436 kJmol-1}.
[REF: University of Waterloo, Bond Lengths and Energies, Link: [2] (Accessed: 17/5/18)]
BBr3
B3LYP/ B: 6-31G (d,p) Br: LANL2DZ
BBr3 contains three heavy atoms (Br). To calculate their effect properly, we require the use of a pseudo-potential.
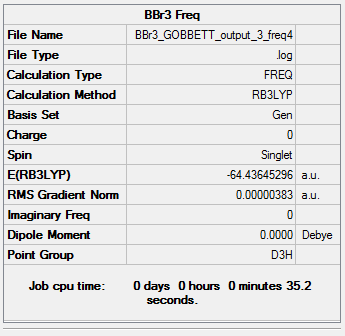
The following BBr3 molecule was optimised via the Imperial cx1 HPC cluster. The optimisation was then checked by frequency analysis, again via the Imperial cx1 HPC cluster.
 Item               Value     Threshold  Converged?
 Maximum Force            0.000008     0.000450     YES
 RMS     Force            0.000004     0.000300     YES
 Maximum Displacement     0.000036     0.001800     YES
 RMS     Displacement     0.000018     0.001200     YES
 Low frequencies ---   -0.0137   -0.0064   -0.0046    2.4315    2.4315    4.8421
 Low frequencies ---  155.9631  155.9651  267.7052
Click this link for the full .log file
BBr3 |
Project: Aromaticity
Benzene
B3LYP/6-31G (d,p)
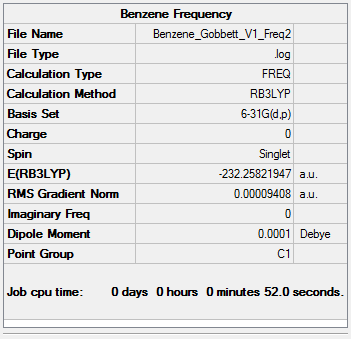
The following benzene molecule was optimised. The optimisation was then checked by frequency analysis.
Item               Value     Threshold  Converged?
 Maximum Force            0.000193     0.000450     YES
 RMS     Force            0.000094     0.000300     YES
 Maximum Displacement     0.000787     0.001800     YES
 RMS     Displacement     0.000368     0.001200     YES
Low frequencies ---  -11.6728   -0.0009   -0.0009    0.0001    6.6686   15.6846
 Low frequencies ---  414.0392  414.6031  621.0860
Click this link for the full .log file
Benzene |
Borazine
B3LYP/6-31G (d,p)
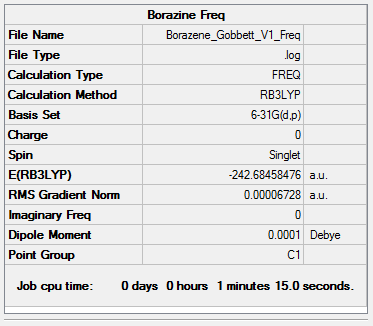
The following borazine molecule was optimised. The optimisation was then checked by frequency analysis.
Item               Value     Threshold  Converged?
 Maximum Force            0.000197     0.000450     YES
 RMS     Force            0.000067     0.000300     YES
 Maximum Displacement     0.000407     0.001800     YES
 RMS     Displacement     0.000163     0.001200     YES
 Low frequencies ---  -17.7329  -11.8586   -9.4862   -0.0008   -0.0002    0.0009
 Low frequencies ---  288.9839  289.5006  404.2292
Click this link for the full .log file
Borazine |
Charge Comparison of Benzene and Borazine
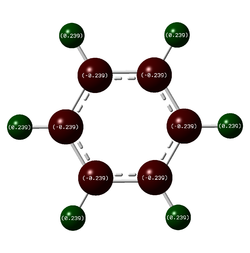
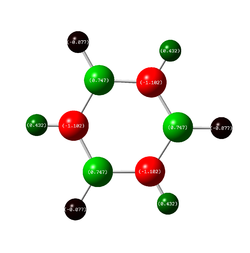
NBO charge analysis was undertaken for both structures. The colour range for both molecules set from -1.102 to 1.102, to ensure the images were visually comparable.
| Benzene | Charge Distribution (Benzene, NBO) | Charge Distribution (Borazine, NBO) | Borazine |
|---|---|---|---|
| As one would expect, the carbon atoms all have the same charge distribution, as do the hydrogen atoms. They are all respectively in the same environment, thus their charge distribution ought to be equal. The C atoms are slightly more negatively charged as C is more electronegative than H (2.55 compared to 2.20 {Pauling Scale, RSC}) but the difference is very small, hence the charge difference is small too. This is why the colouring is dark in the image: both C and H are close to the middle of the scale (seen below) | The charge distribution is more interesting for the Borazine molecule. The most negatively charged atom present is Nitrogen (-1.102) as expected because it is the most electronegative (3.04 {Pauling Scale, RSC}). Boron is in fact less electronegative than hydrogen (2.04 compared to 2.20 {Pauling Scale, RSC}), hence the relative negative numbers on the hydrogen atoms bonded to B (although the difference is so small, the value is a tiny -0.077) | ||
| Thus it is clear that benzene and borazine share very different charge distributions. This is easy to see by eye, comparing the two images above. It is also simply explained by the Pauling scale of electronegativity. In benzene, as discussed, there is a high level of symmetry and the charge distribution is even across the molecule; a slightly electronegative centre surrounded by electropositive hydrogens. In stark contrast is the borazine molecule, in which the central ring is made up of two atoms with electronegativities above and below that of hydrogen. This also has an effect on bond length. In the benzene molecule, the C-H bond distances are all equal, as are all the C-C bond distances. In borazine, the B-N bond distances are equal due to the alternating structure of the ring, but the B-H / N-H bond distances are not the same, lowering the symmetry of the molecule. N holds the H atoms very strongly, as it is significantly more electronegative. This means it also draws electron density to itself, leaving the hydrogen with a slight positive charge. Boron, as discussed, is electropositive with regard to H and so the B-H bonds are much longer. Thus borazine has a much more varied, alternating charge structure to its isoelectric equivalent, benzene. It is worth noting that despite their different charge distributions, the two structures both have neutral overall charge. | |||
Ng611 (talk) 15:16, 31 May 2018 (BST) Good analysis! You mention identical chemical environments for benzene, but you should add a similar line or two of text about borazine (even if it seems obvious to you). Otherwise, good analysis and good explanation.
Comparison of MOs
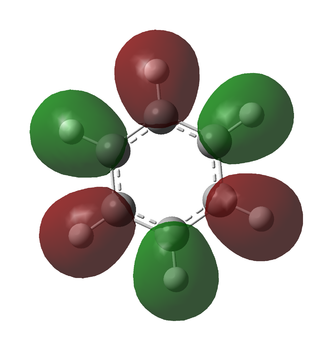
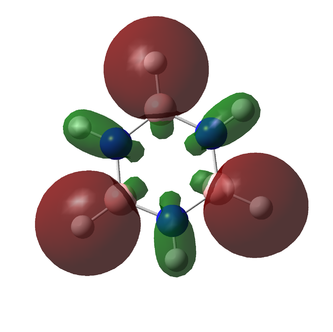
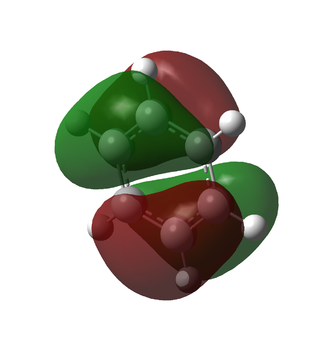
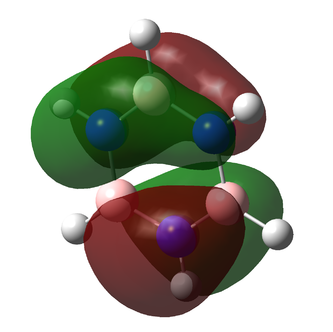
The MOs were calculated for both benzene and borazine and the top 26 were visualised. Below are the comparisons of three of those MOs
| Benzene MO | Borazine MO | Analysis |
|---|---|---|
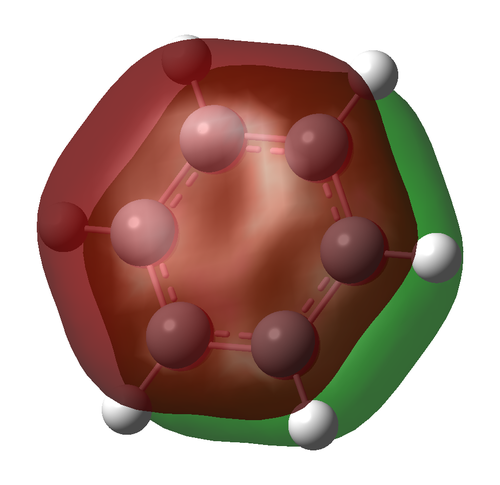
| This set of MOs shows a high energy sigma arrangement. Shown is MO14 for benzene and MO15 for borazine. For both molecules, the MO is composed of the p-orbitals of the ring atoms in the plane of ring. The MO for benzene (E=-0.43854 a.u.) is higher in symmetry and slightly deeper in energy. This is because all the p-orbitals are equally contributing to the MO; whereas in the borazine example (E=-0.43197 a.u.) the symmetry is slightly lower due to the discrepancy between the B and N p-orbital contribution. The N p-orbitals are deeper in energy as N is more electronegative. However, the difference is less significant than in other MOs: both MOs in this case are similar in both shape and energy. | ||
| Shown here is MO13 of benzene and MO16 of borazine. In both cases, the MO shows bonding between a ring atom and its respective hydrogen atom. In each, this results in a sigma arrangement. In the case of benzene, the MO is composed of s-orbitals of the hydrogens and p-orbitals of the carbon atoms. The orbitals have alternating phases, suggesting non-bonding character (even perhaps slight anti-bonding character).
The borazine equivalent MO is composed of s-orbitals of the hydrogens and p-orbitals of either a boron or nitrogen atom. In this case, the relative size of each lobe is affected by the electronegativities of the atoms involved. Where an H s-orbital is interacting with an N p-orbital, the greater electronegativity of the N means its p-orbital is deeper in energy and so dominates the character of the interaction. In the case of the H s-orbital is interacting with a B p-orbital, it is the H that is the more electronegaive and so its s-orbital is deeper in energy. Again, the orbitals have alternating phases, suggesting non-bonding to anti-bonding character. It is due to the significantly reduced symmetry of the borazine MO that the energy difference between these two is more significant than the set above; the benzene MO is notably more symmetrical thus deeper in energy (more stable). The lobes on the inside of the ring of borazine's MO16 are due to rounding errors in the generation of the MO | ||
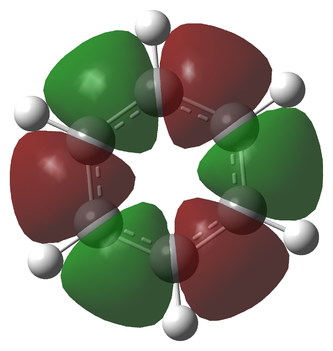
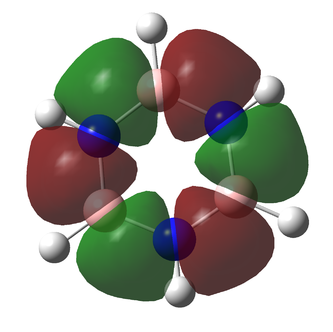
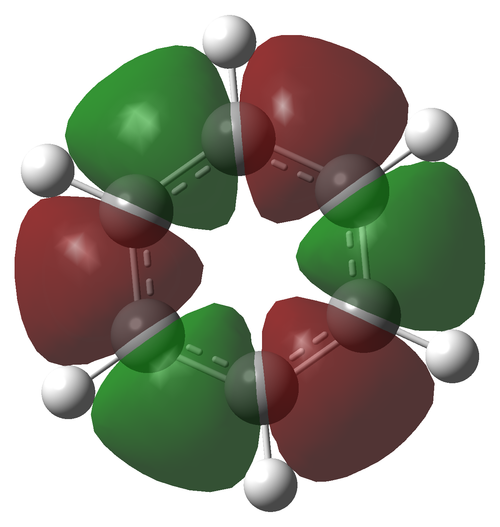
| These are the HOMO MOs for both benzene and borazine (MO20/21). They are each one of two degenerate orbitals and show pi bonding character. For each, the degenerate MO looks the same, but is simply rotated by 90o. In the case of benzene, the MOs are of higher symmetry. This is again due to the fact that each C contributes equally to the MO. Similarly, it is again the case that for the borazine MO, the contributions are not equal (N orbitals being deeper in energy) and so the distribution is not equal. This results in lower symmetry again, with more of the MO centred over the N atoms. Thus borazine has a higher energy HOMO. |
Interesting MOs
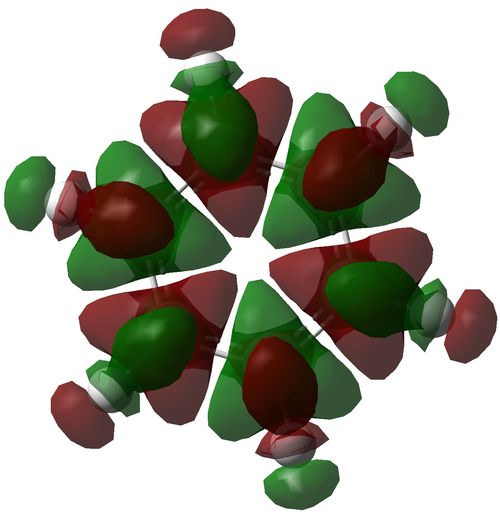
The following MOs are found near the HOMO region of both molecules and serve to show the interesting disparity in shapes that arise from differences in symmetry. Benzene has a symmetrical, bonding MO19, reflecting its higher degree of symmetry. In comparison, the shape of the borazine equivalent shows set of two degenerate non-bonding orbitals of very low symmetry (although it is clear they are degenerate as they have the same energy (-0.31995 a.u.) and have a very similar shape. The differences arise from the differing electronegativities of both B and N, resulting in different distributions in the MOs. It would be an interesting extension to match these calculated MOs to their LCAO equivalents to better explain the results. Unfortunately, there was not sufficient time to do so.
| Benzene MO | Borazine MO I | Borazine MO II |
|---|---|---|
Aromaticity: to be or not to be
Aromaticity is commonly thought of as a description of structures that have a similar set of characteristics caused by their electronic structure. The key characteristics are being planar and having a higher thermodynamic stability than expected due to a specific resonance between certain bonds. Other characteristics include relative chemical stability, lower reactivity and even bond lengths.
The unique resonance was first suggested by Kekule in the 19th century and was greatly expanded on by Huckel in the 1930s. This lead to the development of Huckel's Rules, which attempted to explain aromaticity via a quantum mechanical approach:
For a compound to be aromatic, it must be:
- planar
- cyclic
- a continuous ring of p atomic orbitals perpendicular to plane of the ring
- have (4n + 2) π electrons in the conjugated system
If a compound complied with these rules, it was said to be aromatic and if not is would be anti-aromatic. Anti-aromatic compounds suffer from reduced stability, conversely to their aromatic equivalents (although typically compounds that are "anti-aromatic" tend to twist their conformations so that they are "non-aromatic" - this means they are no longer planar which lowers their overall energy).
For many compounds, these rules work very well to describe and predict aromatic behavior. For many of these compounds, MO theory backs up the conclusions of aromaticity. For example, computing MOs for benzene show the delocalised ring of electrons (from the pz orbitals of each C atom) above and below the plane of the ring:
However, MO calculations show that this is not the sole bonding orbital and that there are many MOs of similar energy that have sigma character. This suggests that the view that aromaticity is defined by solely by orthogonal pz orbitals is flawed and that the real picture is far more complex. An example is included below, in which the MO has sigma character, but still represents a bonding orbital in which the electrons are delocalised (the nodes are atom-based and the MO is cyclic). This MO is formed from p-orbitals in the plane of the ring showing an effect known as σ-aromaticity. Thus, clearly, MO theory has shown that the Huckel view of aromaticity is not complete.
Ng611 (talk) 15:24, 31 May 2018 (BST) You have the beginnings of a good discussion here, but more discussion of the modern view of aromaticity is needed here. What other models of aromaticity are there? How can aromaticity be investigated experimentally? More detail is needed.
[REF: A. Spivey, Aromatic Chemistry, Imperial College, 2016-2017]
[REF: M. Palusiak; T. Krygowski, Application of AIM Parameters at Ring Critical Points for Estimation of p-Electron Delocalization in Six-Membered Aromatic and Quasi-Aromatic Rings, Chemistry Eur, 2007, 13, 7996-8006]
[REF: L. ZH; et al, Sigma-aromaticity and sigma-antiaromaticity in saturated inorganic rings, J Phys Chem, 2005, 109, 16, 3711-3716]
[REF: S. Hadlington, Elusive σ aromaticity captured, Chemistry World, 2014]
Fini
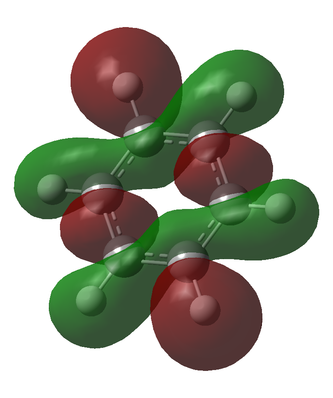
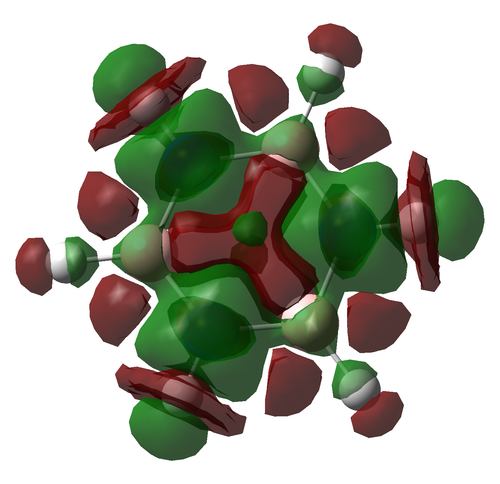
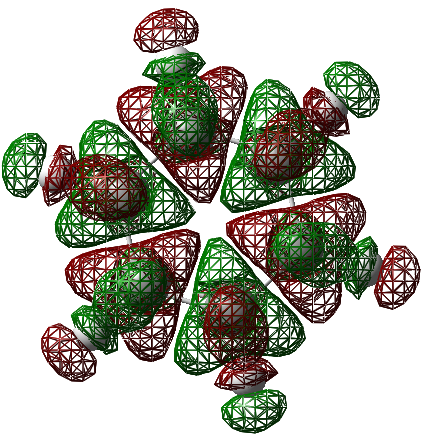
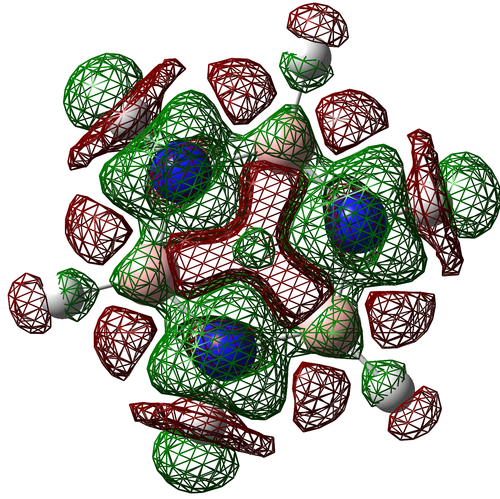
The following MOs are the 120 levels for benzene and borazine respectively. They are included for their sheer aesthetic joy, not for their relevance to any interesting chemistry. To all intents and purposes, these MOs don't exist and can't be reproduced experimentally (to a certainty of over 99.9%), but they are really pretty.
They look even funkier in the "mesh" setting:
Ng611 (talk) 15:21, 31 May 2018 (BST) Very pretty.
Ng611 (talk) 15:25, 31 May 2018 (BST) A good very good report overall. The only major improvement I could suggest is in your discussion on aromaticity. Otherwise, a very well presented piece of work.

