
Ak8916
EXERCISE 1: H + H2 system
Question 1: What value do the different components of the gradient of the potential energy surface have at a minimum and at a transition structure? Briefly explain how minima and transition structures can be distinguished using the curvature of the potential energy surface.
Gradient of the potential energy surface at both the maxima (corresponding to the transition structure) and the minima would be 0. However, the second derivative at the maxima would be negative while the second derivative at hte minima would be positive and this method could be used to distinguish the two.
Ng611 (talk) 19:44, 24 May 2018 (BST) What directions would you evaluate the PES along to confirm that the point you're looking at is a saddle point?
Question 2: Report your best estimate of the transition state position (rts) and explain your reasoning illustrating it with a “Internuclear Distances vs Time” plot for a relevant trajectory.
The found transition state position corresponds to r1=r2=0.9079 This is the transition state position as internuclear distance of both AB and BC do not osciallte at all as the gradient at transition state is 0.
-
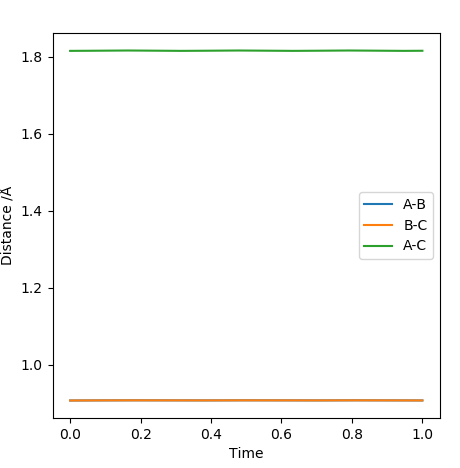
Figure 1

Question 3: Comment on how the mep and the trajectory you just calculated differ.
Dynamic mode depicts a realistic path of the trajectory following the low energy transition state that is, oscillatory behaviour is observed.
However, the mep calculation implies that once the transition state is reached, there are no longer oscillations and Kinetic Energy at each step is taken as zero.
-
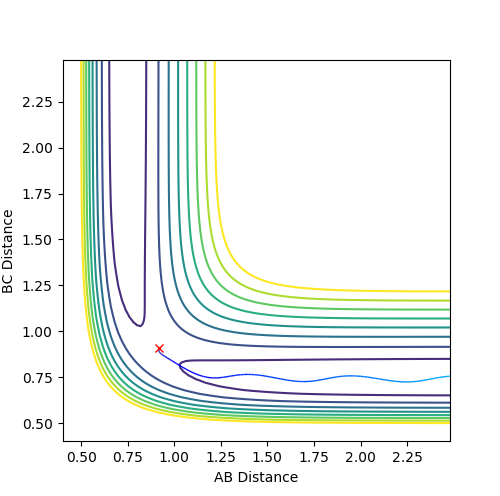
Figure 2 (a) -
Figure 2 (b)

Question 4: Complete the table by adding a column with the total energy, and another column reporting if the trajectory is reactive or unreactive. For each set of initial conditions, provide a plot of the trajectory and a small description for what happens along the trajectory.
| p1 | p2 | Reactivity |
|---|---|---|
| -1.25 | -2.50 | Reactive |
| -1.5 | -2.0 | Unreactive |
| -1.5 | -2.50 | Reactive |
| -2.5 | -5.0 | Unreactive |
| -2.5 | -5.2 | Reactive |
Case 1: Reactive
-
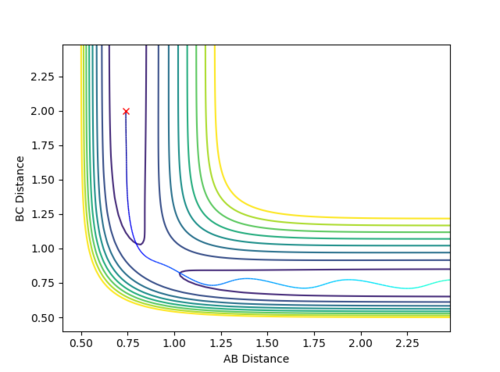
Figure 3 (a) -
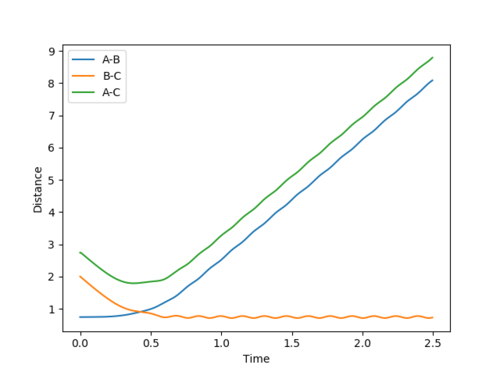
Figure 3 (b)


The contour plot clearly passes through the transition state and allows for the reaction to take place. Also, the plot of internuclear distance versus time depicts a clear crossing point where r1=r2 hence the transition state is reached.
Case 2: Unreactive
-
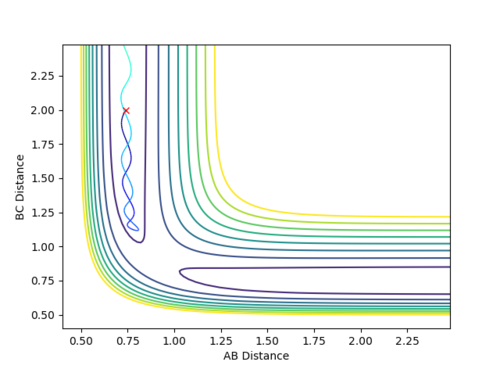
Figure 4 (a) -

Figure 4 (b)


The contour plot depicts that the trajectory takes the reactants back towards the reactants instead of the products. Also, the plot of internuclear distance versus time does not have any point of time at which r1=r2 hence never reaching the transition state thereby unreactive
Case 3: Reactive
-
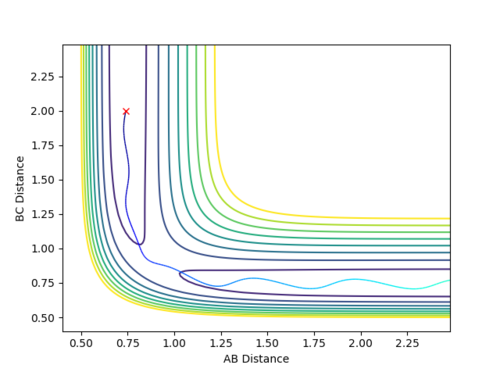
Figure 5 (a) -
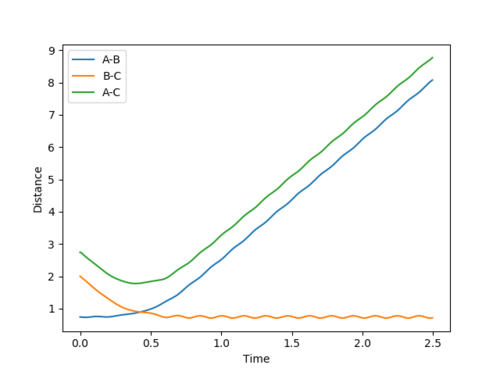
Figure 5 (b)


The contour plot produced shows a clear movement from reactants to products and the positions r1 and r2 are also seen to co-inside in the plot of internuclear distance versus time after which the reactants and products switch trajectories showing that A-B bond breaks and B-C bond forms thereby rendering the process reactive
Case 4: Unreactive
-
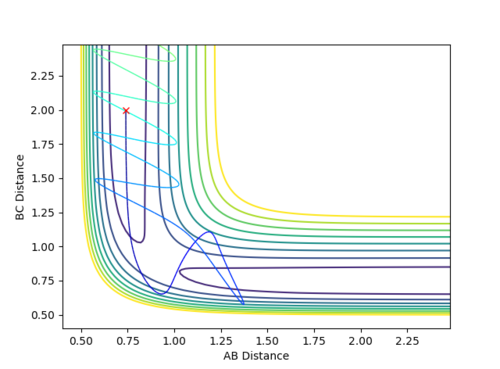
Figure 6 (a) -
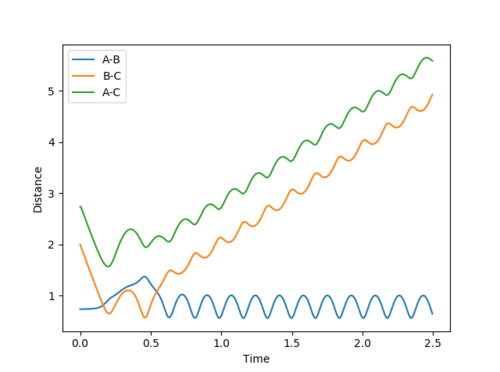
Figure 6 (b)


The contour plot begins from the reactants and heads towards the transition state but is reverted back to the reactants without making products. It does reach the transition state (as evident by the cross-section of the inter-nuclear distances of A-B and B-C but does not from products as the internuclear trajectories then revert to their initial values thereby rendering the process unreactive
Case 5: Reactive
-
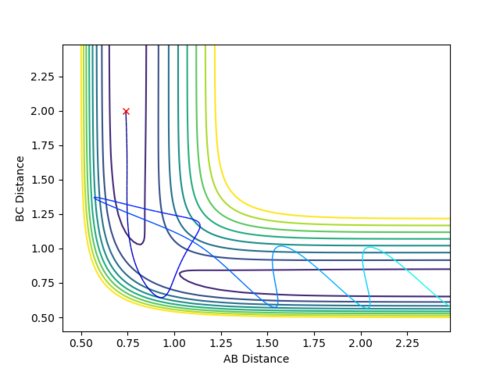
Figure 7 (a) -
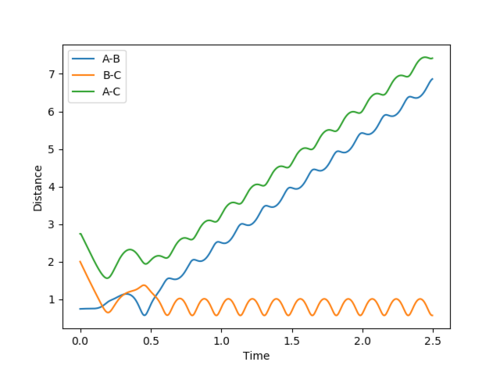
Figure 7 (b)


Although the contour shows that the process follows a rather strange trajectory, it is still a reactive pathway as products are successfully formed and so the path is a reactive one.
Question 5: State what are the main assumptions of Transition State Theory. Given the results you have obtained, how will Transition State Theory predictions for reaction rate values compare with experimental values?
Although the Transition State Theory is widely used for conceptual understanding of the mechanism of an underlying chemical reaction, the theory does pose its set of limitations.
The theory assumes a special kind of equilibrium between reactants and products which is also known as a quasi equilibrium.
1. The atomic nuclei behave classically and hence does not account for quantum effects such as tunnelling.
2. Once a transition state is crossed, the system is sure to form products and will not revert back to the reactants.
3. The system only takes the pathway involving the lowest energy transition state.
The first assumption causes drastic deviaiton from theory when quantum tunneling is most likely to be obsevred and that is the case where mass of atoms and molecules involved is small as is the case in H + H2 system studied above. In this case, TST would underestimate the rate of reaction.
The second assumption clearly breaks in the calculations conducted as several of the initial condiitons produce a case where the transition state is crossed but the system reverts to the side of the reactants. In this case, TST would overestimate the rate of reaction.
The third assumption falls when a reaction is carried out at a high temperature such that higher vibrational modes can be populated and it no longer necessary that the lowest energy transition state pathway would be chosen for reaction completion.
Keeping these limitations in mind, it can be expected that the Transition State theory overestimates the rate of the reaction as quantum effects fall greatly as mass is increased and are most commonly observed via electronic movements through the barrier.
Ng611 (talk) 19:48, 24 May 2018 (BST) You're right that TS theory overestimates the rate, and that quantum tunneling effects become smaller as mass increases. However, it's really important to make it excplicit that this overestimation is due to TS recrossing. You seem to have understood this, but just not written it down.
EXERCISE 2: F - H - H system
Question 1 (a) (i): Classify the F + H2 according to their energetics (endothermic or exothermic). How does this relate to the bond strength of the chemical species involved?
-
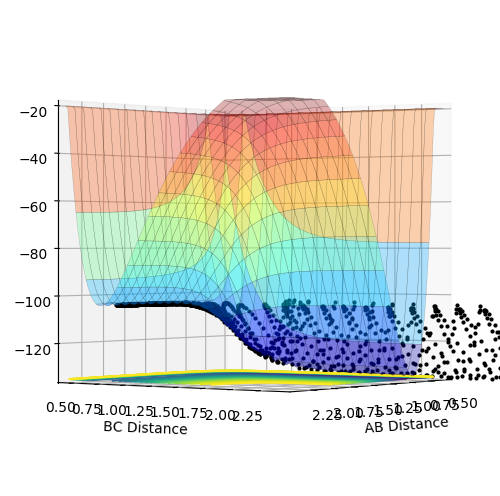
Figure 8

It is an exothermic reaction as energy of the products is lower than that of the reactants as depicted in the surface plot of Figure 8 above.
Comparing the produced surface to theoretical expectation using bond strengths and applying the following formula: strength of bond broken - strength of bond formed gives the following mathematical argument:
bond strength (H-H) - bond strength (F-H)
432 kJ/mol - 565 kJ/mol =-133 kJ/mol
A negative result confirms that the reaction is indeed exothermic.
Question 1 (a) (ii): Locate the approximate position of the transition state.
Now, since the system being studied is no longer symmetric, we cannot approximate the transition state such that r1=r2.
Hence, a reactive trajectory was first plotted as shown below whose distance versus time and contour plots were used to aid in determining the transition state location.
-
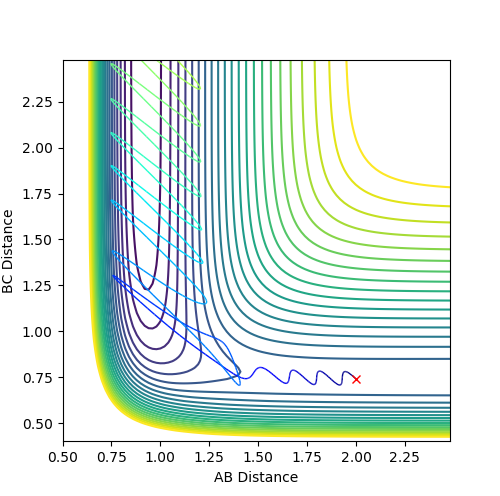
Figure 9

A-B Dist: 2.00 B-C Dist: 0.74 A-B Momentum: -1.50 B-C momentum: 0
There after, a magnified version of the distance versus time plot was drawn and the intersection point was found as depicted below.
Transition State:
| F-H | H-H |
|---|---|
| 1.81087 | 0.74466 |
-
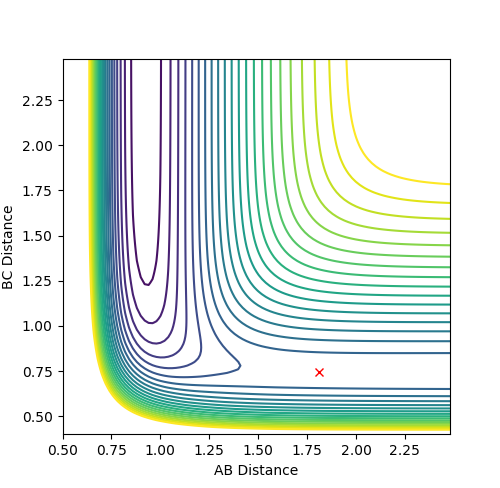
Figure 10 (a) -
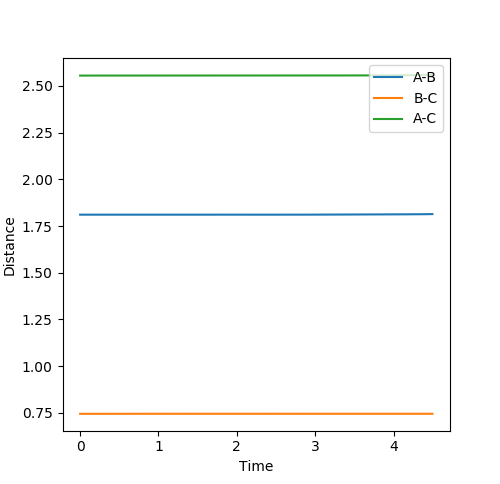
Figure 10 (b)


The plots above are characteristic of a transition state and depict that it occurs such that no oscillatory behaviour is observed and it the system was left at these locations with 0 momentum, there would not be an observable trajectory tending towards either the reactants or the products.
Also, the observed values of H-H and F-H depict that it is an early transition state such that it looks a lot like the reactants with H-H almost equal to the bond distance.
Question 1 (a) (iii): Find the activation energy for the reaction.
In order to find the activation energy, we need to find the difference between the energy of reactants and that of the transition state. In order to determine the energy of the reactants, the F-H distance is displaced from that which corresponds to the transition state such that the reactions tends towards the reactants as depicted in the contour plot below.
The corresponding energy versus time plot was recorded to see the drop in potential energy.
| Energy of Reactants | Energy of Products | Activation Energy |
|---|---|---|
| -103.752 | -104.006 | 0.254 |
-

Figure 11 (a) -
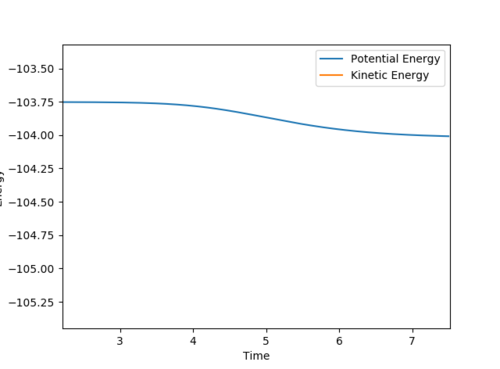
Figure 11 (b)


Question 1 (b) (i): Classify H + HF according to energetics (endothermic or exothermic). How does this relate to the bond strength of the species involved?
It is an endothermic reaction as the total energy is positive.
Energy released corresponds to strength of bond broken - strength of bond formed
bond strength (H-F) - bond strength (H-H)
565 kJ/mol - 432 kJ/mol = 133 kJ/mol
Question 1 (b) (ii): Locate approximate position of the transition state.
The transition state in this case is very very late as H-F have a very high affinity due to the electronegativity of F and the strong polar covalent bond between the two atoms. As per Hammond postulate, a late transition state mirrors the product hence H-H distance almost mirrors H-H bond distance.
Transition State:
| F-H | H-H |
|---|---|
| 1.81087 | 0.74466 |
-
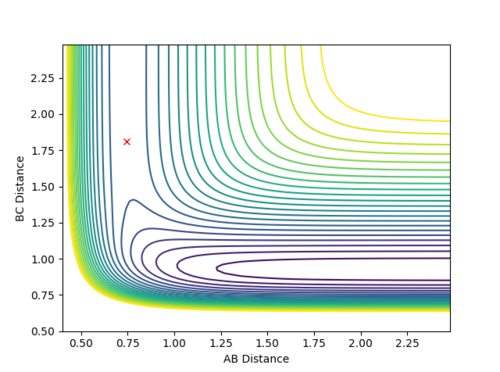
Figure 12

Question 1 (b) (iii): Find the activation energy for the reaction.
| Energy of Reactants | Energy of Products | Activation Energy |
|---|---|---|
| -103.752 | -133.405 | 29.653 |
-
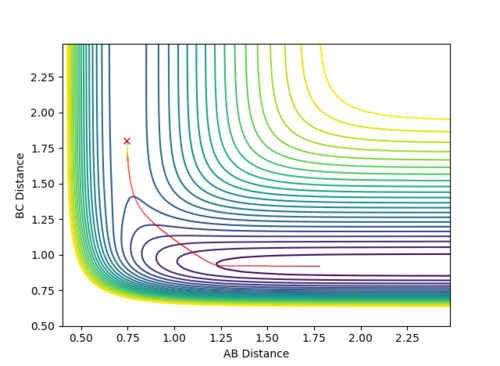
Figure 13 (a) -
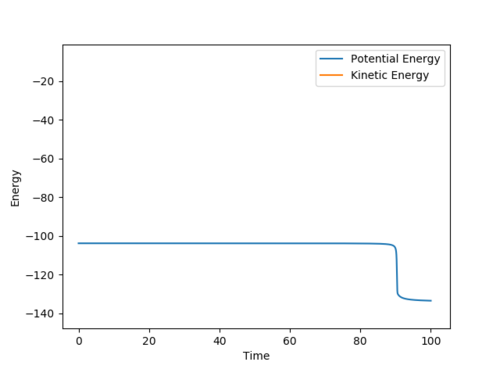
Figure 13 (b)


Question 2 : Reaction Dynamics
Question 2 (a) (i): In light of the fact that energy is conserved, discuss the mechanism of release of the reaction energy. How could this be confirmed experimentally?
-

Figure 14 (a) -
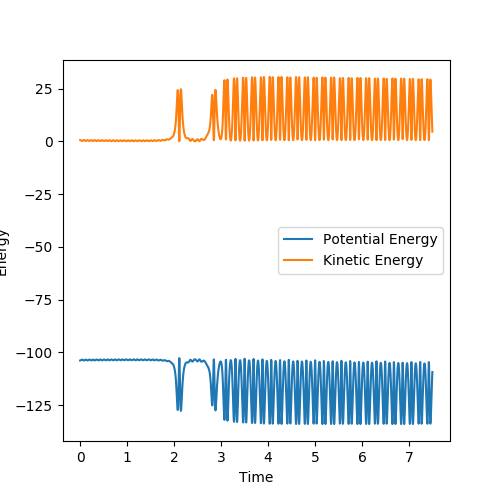
Figure 14 (b)


Energy conservation implies that the energy cannot be created or destroyed, only transferred from one form to another. Figure 14 (a) and (b) above depict the contour and energy/time plots of a reactive trajectory.
In this case, energy could be converted to translational or vibrational energy.
Conversion to translational energy could be detected using Doppler broadening as it results from a distribution of velocities of atoms or molecules which give rise to different Doppler shifts. The cumulative effect of this is the broadening of the sepctral line.
The conversion to translational energy can be detected via IR spectroscopy as it records different vibrational modes that cause a change in the dipole moment.
Question 3: Discuss how the distribution of energy between different modes (translation and vibration) affect the efficiency of the reaction, and how this is influenced by the position of the transition state.
Cases Studied
F + H2 --- H-F + H
H-H 0.74 F-H 2.3 p(F-H)= -0.5
| p(F-H) | p(H-H) | Reactivity |
|---|---|---|
| -0.5 | -3.0 | Unreactive |
| -0.5 | -2.0 | Unreactive |
| -0.5 | -1.0 | Unreactive |
| -0.5 | 1.0 | Unreactive |
| -0.5 | 2.0 | Unreactive |
| -0.5 | 3.0 | Unreactive |
All the studied cases led to an unreactive trajectory although a lot of vibrational energy was being put into the system. The following figures depict the contour maps of three of the unreactive trajectories. (The positive and negative values of momentum of H-H correspond to the same overall energy).
-

Figure 15 (a) -

Figure 15 (b) -

Figure 15 (c)


However, as the momentum of H-F was increased and that of H-H reduced, a reactive trajectory was found with the following conditions:
| r(F-H) | r(H-H) | p(F-H) | p(H-H) | Reactivity |
|---|---|---|---|---|
| 2.30 | 0.74 | -0.8 | 0.10 | Reactive |
The contour map below corresponds to the reactive trajectories with the given initial conditions.
-

Figure 16

The performed analysis and calculations shed light upon the necessary distribution of energies in the system. It can be inferred that in case of an early transition state, the amount of vibrational energy put into the system does not greatly increase the efficiency of the reaction while the translational energy can severely impact the rate of the reaction.
H + H-F --- H-H + F
This is now a system with a late transition state and several cases with different initial conditions were studied and calculations were performed.
| r(H-H) | r(H-F) | p(H-H) | p(H-F) | Reactivity |
|---|---|---|---|---|
| 2.30 | 0.93 | -3.0 | 0.10 | Unreactive |
| 2.3 | 0.93 | 0.5 | 15 | Reactive |
-

Figure 17 (a) -
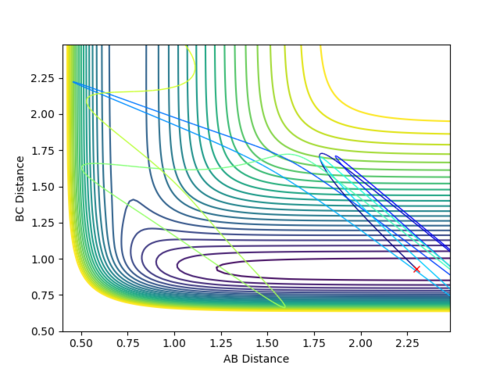
Figure 17 (b)


It can be seen that the reaction completion now greatly depends on the vibrational energy that the system has rather than the translational one as Figure 17 (b) corresponds to the reactive set of conditions with very high values of momentum.
The studied cases depict the importance of the interplay between vibrational and translational energy and their relevance to the kind of transition state being studied (early or late).
Ng611 (talk) 19:53, 24 May 2018 (BST) Good examples. Your final trajectory could be improved slightly -- you shouldn't need so much vibrational energy to make the reaction go.
Ng611 (talk) 19:53, 24 May 2018 (BST) Good second section and a good overall report. Try to structure your wiki a bit better, using sections and subsections to make it easier to comment on.
- ↑ 1. P. Atkins, J. De Paula and P. Atkins, Atkins' Physical chemistry, Oxford University Press, Oxford, 2002.