Ajm308:burma
Andrew James Marks - 00548888
Introduction
GaussView 3 and Gaussian will be used to investigate the bonding properties of a series of simple molecules. The power of computational chemistry will be assessed, including it's ability to accurately represent reality, and the efficiency of its use as a model relative to pre-existing, manual models such as LCAO.
In assessing the capabilities of computational chemistry related to bonding and structure, investigations in to BH3, TlBr3 and two isomers of a simple molybdenum complex will be carried out.
BH3
Optimisation
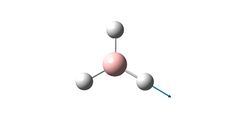
Initially, Borane was modelled in GaussView 3, with the bond lengths set to 1.5 Angstroms. The optimisation was then carried out, using the method contained in the summary of the results in the table below. The output file can be found here: [[1]]
Optimised BH3 Structure |
The optimisation indicated a bond length of 1.19 A, and a bond angle of 120.0o. The calculated bond length corresponds well with the literature [1.1867] [1], and the bond angle is consistent with the trigonal planar structure.
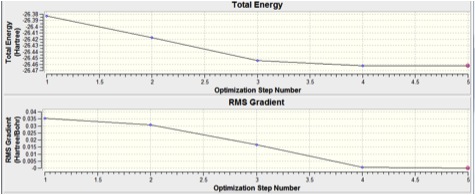
Summary of Results:
| File type | .log |
| Calculation type | FOPT |
| Calculation method | RB3LYP |
| Basis set | 3-21G |
| Final energy (au) | -26.4622 |
| RMS Gradient (au) | 0.00000285 |
| Dipole moment (Debye) | 0.0 |
| Point group | D3H |
| Job time | 32.0 (seconds) |
As the RMS Gradient is below 0.001, the optimisation is taken to be complete.
NBO Analysis
A Natural Bond Orbital [NBO] analysis was performed using the .log file generated from the population analysis of Borane. Using GaussView, an image illustrating the charge distribution throughout the molecule was generated. The information generated concurs with my predictions, the electron deficient boron atom is green, and positively charged, whereas the electron rich hydrogen atoms and red and negative.
NBO analysis is shown below:
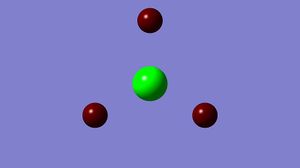
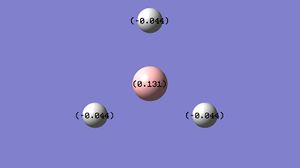
The two diagrams show the same information, one with colour and one with numbers.
Molecular Orbitals
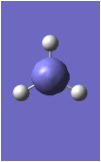
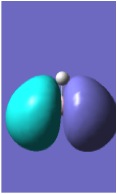
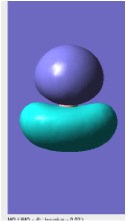
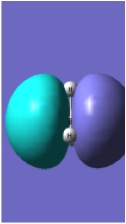
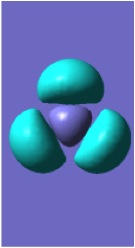
The molecular orbitals for BH3 were computed and the first eight surfaces are displayed below DOI:10042/to-6747 :
 |
 |
 |
 |
 |
 |
 |
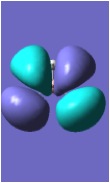 |
Using the .chk file from the BH3 optimisation, molecular orbitals could then be computed. The method was set to "energy" with the additional key words "pop=full". The computed molecular orbitals were visualised using GaussView 5.0 and are shown above.
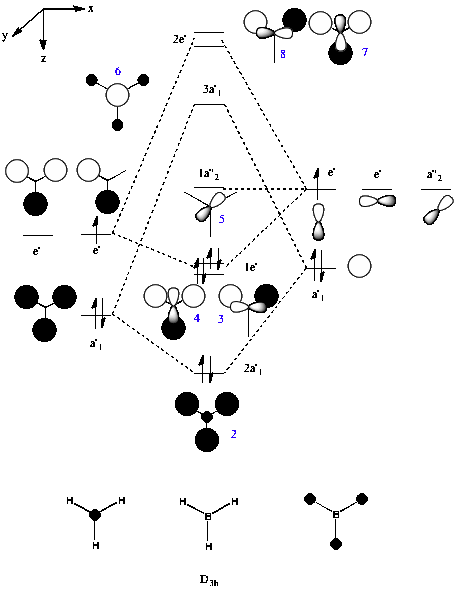
The computed molecular orbitals were then compared to those derived using the LCAO approach in the MO diagram for BH3 below:
The computer generated molecular orbitals match well with molecular orbitals obtained with the LCAO approach. The blue numbers on the LCAO derived molecular orbital diagram indicate the number of the molecular orbital and is comparable to the numbers in the images of the molecular orbital surfaces generated by the computer. The qualitative MO theory used to produce valence molecular orbital diagrams is clearly of use in determining molecular orbitals for simple molecules. The LCAO approach can be used, and applied to a variety of molecules, with a beginners level of understanding of atomic orbitals. The computational method requires less time, and once computational methods are learned, again, a low level of understanding of the actual processes in producing the molecular orbitals is required. For more complex molecules, it can be predicted that although the computational methods used in this example may become less realistic, more comprehensive methods can be utilised. Coupled with the limitations of the LCAO approach it can therefore be deduced that computational methods will be more accurate for more complex molecules than the manual, LCAO approach.
Vibrational Analysis
Vibrational analysis was then performed. Analysis involves computing the second derivative of the potential energy surface, if all vibrational modes are positive, a minima on the potential energy surface has been located. The calculation was performed upon the fully optimised structure. The job type was changed to 'Frequency' and additional keywords 'pop=(full,nbo)' were added. The job was submitted to Gaussian ensuring that the method and basis set were the same as used in the optimisation, namely RB3LYP and 3-21G respectively. The calculation ran in 24 seconds.
Polyatomic molecules are known to have 3N-6 vibrations, so it was anticipated that 6 vibrations would be present.
The 6 vibrations present in the molecule are detailed in the table below:
The infra-red spectrum was also computed and is shown below:
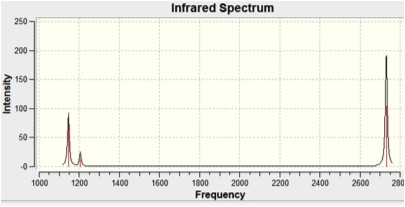
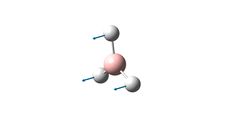
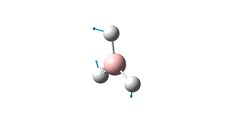
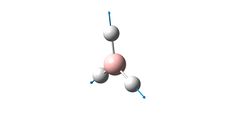
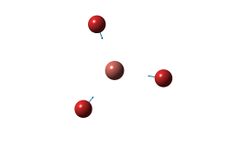
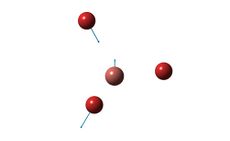
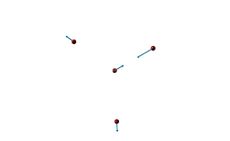
There are clearly not six peaks in this spectrum. This can be accounted for by looking at the degeneracy of some of the vibrations and the zero intensity of Vibration 4. Degeneracy can be seen in the symmetry of the vibrations and the vibrational frequencies of the degenerate pairs (5&6, 2&3). Zero intensity of Vibration 4 can be explained by looking at the displacement vectors in the diagram above. These show that during the vibration there is no change in the dipole moment - a requirement for the of IR spectral transitions.
In addition, there are 6 low frequency vibrations, arising due to vibrations of the molecular centre of mass. These can only be obtained from the output .log file, located here [[2]].
-69.0233 cm-1
-66.0138 cm-1
-64.7529 cm-1
-0.0003 cm-1
-0.0001 cm-1
0.0005 cm-1
TlBr3
Optimisation
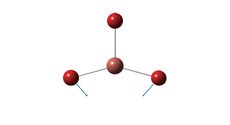
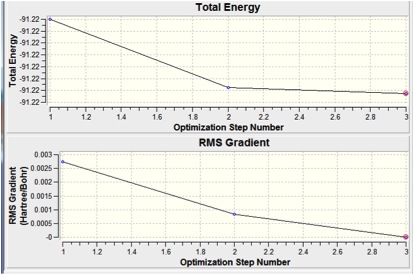
TlBr3 was modelled in GaussView 3, and the symmetry was restricted to D3h, with "very tight (0.0001)" tolerance. The molecule was then optimised (as per the method below). Results obtained can be found in the output .log file here [[3]].
Optimum Tl-Br bond distance: 2.65 A
Optimum Br-Tl-Br bond angle: 120.0°
Summary of Results:
| File type | .log |
| Calculation type | FOPT |
| Calculation method | RB3LYP |
| Basis set | LANL2DZ |
| Final energy (au) | -91.22 |
| Gradient (au) | 0.0000009 |
| Dipole moment (Debye) | 0.0 |
| Point group | D3H |
| Job time | 2 minutes 38.0 seconds |
The optimised bond length is in good agreement with the literature [2.512 A] [2] The calculation is less accurate than with BH3. The accuracy of the calculation could be increased by utilising a larger basis set, however this would be accompanied by a greater computational cost. The bond angle is in perfect agreement with the anticipated trigonal planar structure.
Vibrational Analysis
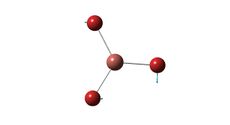
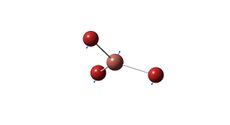
Vibrational analysis was then performed. Analysis involves computing the second derivative of the potential energy surface, if all vibrational modes are positive, a minima on the potential energy surface has been located. The calculation was performed upon the fully optimised structure. The job type was changed to 'Frequency' and additional keywords 'pop=(full,nbo)' were added. The job was submitted to Gaussian ensuring that the method and basis set were the same as used in the optimisation, namely RB3LYP and LANL2DZ respectively. The calculation ran in 1 minute 32 seconds.
Polyatomic molecules are known to have 3N-6 vibrations, so it was anticipated that 6 vibrations would be present.
The 6 vibrations present in the molecule are detailed in the table below:
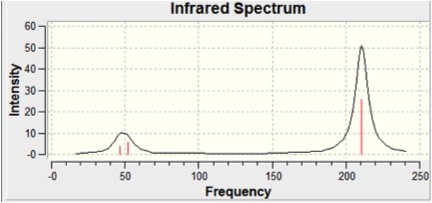
IR Spectra was also computed:
As with BH3 there are clearly not six peaks in this spectrum. This can be accounted for by looking at the degeneracy of some of the vibrations and the zero intensity of Vibration 4. Degeneracy can be seen in the symmetry of the vibrations and the vibrational frequencies of the degenerate pairs (5&6, 2&3). Zero intensity of Vibration 4 can be explained by looking at the displacement vectors in the diagram above. These show that during the vibration there is no change in the dipole moment - a requirement for the of IR spectral transitions.
In addition, there are 6 low frequency vibrations, arising due to vibrations of the molecular centre of mass. These can only be obtained from the output .log file, located here [[4]].
-3.4213 cm-1
-0.0026 cm-1
-0.0004 cm-1
0.0015cm-1
3.9367 cm-1
3.9367 cm-1
What is a bond?
A bond is an attraction between species. Bonds are formed due to a variety of attractions and can be ionic or covalent in nature. It is more simple to define bonds in organic chemistry than in inorganic chemistry. In inorganic systems, bonding is not as simple as σ and π bonds, especially in transition metal chemistry. GaussView draws bonds to predetermined distances, but when a file is created in GaussView to run a calculation, only the co-ordinates of species are given in the file, not where bonds have been physically drawn. Bond lengths vary largely, and predetermined distances will not take into account every bond possible. Bonding can be rationalised using molecular orbital theory and molecular orbital calculations.
In terms of electron density, a bond may be considered a region of high electron density between two species, whereas a lack of electron density between two species is conversely a lack of bond. In this sense, both molecular orbitals and simple lines drawn serve as good indicators of what bonding really is, although it is easier to appreciate the true nature of bonding by considering molecular orbitals.
Investigation of Isotopes of Mo(CO)4(PCl3)2
Optimisation
The two isotopes of the Molybdenum species, cis and trans, were initially optimised roughly using the RB3lYP method and the LANL2MB basis set. The two output files can be found here [cis, trans] [[5]], [[6]]
Using the outputs from the initial optimisation, the two structures were then further optimised by firstly altering the dihedral angles to ensure the correct minima was found by the computer, and was then carried out using the basis set LANL2DZ. The two output files can be found here [cis, trans] DOI:10042/to-6932 DOI:10042/to-6933
The two fully optimised structures are shown below:
Optimised Cis Structure |
Optimised Trans Structure |
Cis Mo-P bond length= 2.51 A
Trans Mo-P bond length= 2.44 A
Literature bond length= 2.4442 A< [3]
Both cis and trans bond distances compare well with literature. Mo-P bond lengths in the literature are obtained from the complex [Mo(CO)5P(OH)3] and as such, an exact comparison is not expected. The Mo-P bond length is longer for the cis isomer. This is likely a result of steric strain the phosphine ligands, as they are in close proximity in cis complex.
The energies of the two isomers are almost identical. If the full value for the energy is taken, it can be seen that the cis isomer is the more stable isomer, although it the accuracy of the calculation does not stretch to this level.
Cis isomer: -623.57707173 a.u.
Trans isomer: -623.57603102 a.u.
Vibrational Analysis
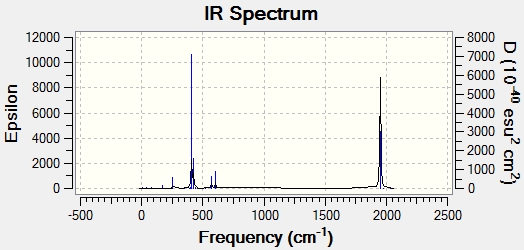
Vibrations for both isomers were then computed along with the relevant IR spectra. All vibrational frequencies were positive, indicating that optimisation had found a minima.
The method used was 'Frequency', ensuring that the same basis set and calculation method were used, as in the optimisation. These were RB3LYP and LANL2DZ respectively. Output files can be located here:
Trans isomer: [[7]]
Cis isomer: [[8]]
IR spectra:
Trans:
Cis:
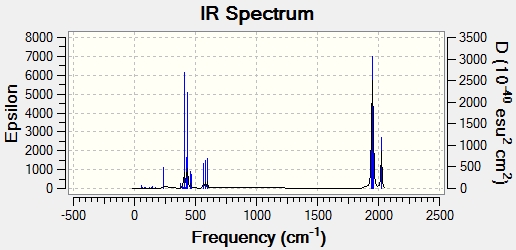
The CO stretching frequencies for the two isomers are shown below:
| Trans | |
| Frequency (cm-1) | Intensity |
| 1950 | 1475 |
| 1951 | 1467 |
| 1977 | 1 |
| 2031 | 4 |
| Cis | |
| Frequency (cm-1) | Intensity |
| 1945 | 762 |
| 1950 | 1500 |
| 1959 | 634 |
| 2024 | 597 |
Literature stretches: [4]
Trans: 1895 cm-1
Cis: 2019 cm-1, 1922 cm-1,1905 cm-1,1899 cm-1
Literature values compare well with the computed values, even considering that literature stretches were obtained from a different complex.
There are 4 stretches for the cis isomer, yet only 1 stretch for the trans isomer. The trans isomer has 2 vibrations infra-red inactive stretches and one degenerate pair, accounting for the singly peak observed. The cis isomer has 4 unique vibrations - all infra-red active. Infra-red spectroscopy is clearly a useful tool in determining the which isomer is present.
Mini Project - Exploring Bonding in Main Group Halides
Main Group Halides Under Investigation
It was decided to invesitgate four similar main group halides. These are:
AlCl6 - MGH1
AlCl4Br2 - Bromine atoms in the bridging positions - MGH2
AlCl4Br2 - Bromine atoms on one terminal - MGH3
AlCl4Br2 - Bromine atoms on opposite terminals - MGH4
Optimisation
Initial structures were modelled in GaussView 3. The 4 initial structures (MGH 1-4) were then submitted to Gaussian to be optimised with the RB3LYP method, and the 6-31G basis set. Optimised molecules are shown below, and links to output .log files are included.
MGH1: DOI:10042/to-7065
Total Energy: -3246.32 a.u
Dipole Moment: 0.0114 Debye
RMS Gradient: 0.0001 a.u
The optimised B-Cl bridging bond length was found to be 2.41 A [Lit: 2.3][5]. The B-Cl terminal bond length was found to be 2.17 A [Lit: 2.08][6]. The B-Cl-B angle was found to be 93.7 degrees [Lit: 90.9][7]
MGH1 |
MGH2: DOI:10042/to-7068
Total Energy: -7469.12 a.u
Dipole Moment: 0.6530 Debye
RMS Gradient: 0.0027 a.u
MGH2 |
MGH3: DOI:10042/to-7069
Total Energy: -7469.13 a.u
Dipole Moment: 1.3103 Debye
RMS Gradient: 0.000005 a.u
MGH3 |
MGH4: DOI:10042/to-7070
Total Energy: -7469.13 a.u
Dipole Moment: 0.2008 Debye
RMS Gradient: 0.00095 a.u
MGH4 |
As the RMS Gradient was not below 0.001 for MGH2, it was decided to run the optimisation again, on the initially optimised molecule.DOI:10042/to-7073 ,
Summary of Results:
Total Energy: -7469.13 a.u
Dipole Moment: 1.0491
RMS Gradient: 0.00002 a.u
The change in dipole moment indicates a change in structure on the 2nd optimisation.
The total energy of the three dimers containing 2 Bromine atoms is -7469.13 a.u in all cases. This indicates that the presence of the Bromine atoms, in any position, are able to stabilise the dimer, relative to the AlCl6 dimer. This can be accounted for by considering the less electronegative nature of the Bromine atoms. They are less able to remove electron density from the already electron deficient Aluminium atom, thus stabilising the dimer.
The Dipole moment of the three Bromine containing dimers changes as the location of the Bromine atoms changes. This is to be expected, with the greatest dipole moment occuring when the 2 Bromine atoms are on the same Aluminium atom. Again, this is as anticipated.
Vibrational Analysis
Vibrational analysis was then performed on the fully optimised structures of MGH 1-4.
The output files can be found here:
MGH1 DOI:10042/to-7074 MGH2 DOI:10042/to-7075 MGH3 DOI:10042/to-7078 MGH4 DOI:10042/to-7077
When the calculation was carried out on MGH1, all the vibrational frequencies were returned positive, indicating that a minima had been found on the Potential Energy surface in the optimisation step.
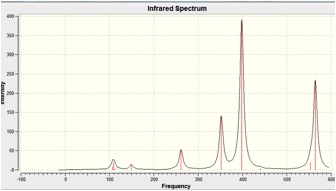
The IR Spectra is shown below:
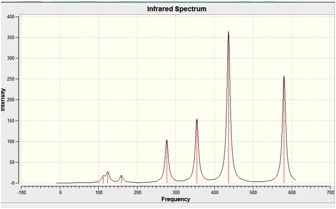
In Al2Cl6, intense peaks appear at 360.3, 449.2, 597.5cm-1 which is consistent with literature values of 420, 484, and 625 cm-1.[8].
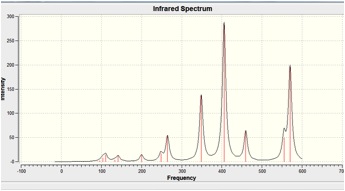
When the calculation was carried out on MGH2, all the vibrational frequencies were returned positive, indicating that a minima had been found on the Potential Energy surface in the optimisation step.
The IR Spectra is shown below:
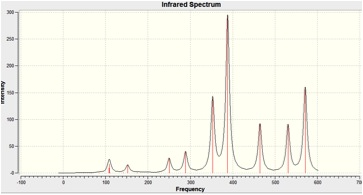
When the calculation was carried out on MGH3, all the vibrational frequencies were returned positive, indicating that a minima had been found on the Potential Energy surface in the optimisation step.
The IR Spectra is shown below:
When the calculation was carried out on MGH4, all the vibrational frequencies were returned positive, indicating that a minima had been found on the Potential Energy surface in the optimisation step.
The IR Spectra is shown below:
Molecular Orbitals
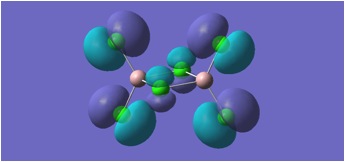
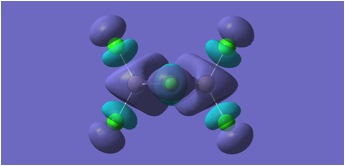
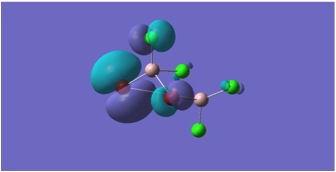
HOMO and LUMO Molecular orbitals are shown for MGH 1-4.
MGH1:
MGH2:
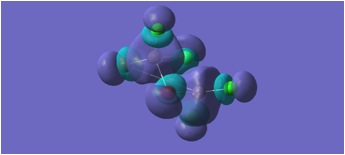
MGH3:
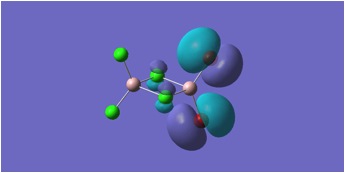
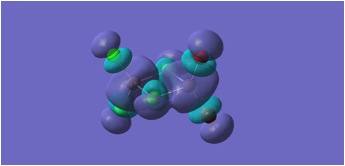
MGH4:
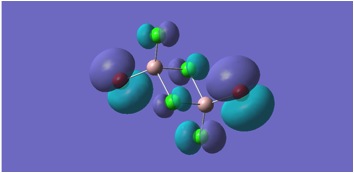
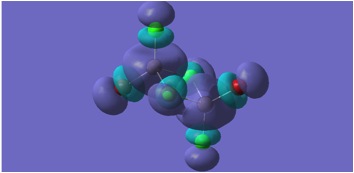
The molecular orbitals depicted in the above diagrams are all similar. This is to be expected as it can be anticipated that in the HOMO-LUMO region, similar atomic orbitals are being utilised by both chlorine atoms and bromine atoms.
This accounts for the similarity in the molecular orbitals depicted, however, the increased diffusivity of the bromine atomic orbitals clearly accounts for the more diffuse areas of electron density suggested in the molecular orbitals around the bromine atom.
Regions of electron density in the HOMO of MGH1, are clearly more diffuse around terminal chlorines than bridging chlorines. This may be due to the reduced electron density within the Al-Cl-Al bridge, where a 3c-2e bond is in place, as opposed to the more typical 2c-2e bonds to terminal chlorines.
References
- ↑ The Ab Initio Limit Quartic Force Field of BH3: DOI:10.1002/jcc.20238
- ↑ On the Structures of the Hydrated Thallium(III) Ion and its Bromide Complexes in Aqueous Solution: DOI:10.3891/acta.chem.scand.36a-0125
- ↑ Synthesis of molybdenum complex with novel P(OH)3 ligand based on the one-pot reaction of Mo(CO)6with HP(O)(OEt)2 and water : DOI:10.1016/j.inoche.2004.09.012
- ↑ X-ray structural studies of cis-Mo(CO)4(PR3)2 (R = Me, Et, n-Bu) derivatives and their relationship to solution isomerization processes in these octahedral species: DOI:10.1021/ic00137a026
- ↑ Chey et al; π-Complexes of Alkenes to Trivalent Aluminium, Organometallics, 1990, 9, 2430-2436.
- ↑ Chey et al; π-Complexes of Alkenes to Trivalent Aluminium, Organometallics, 1990, 9, 2430-2436.
- ↑ Chey et al; π-Complexes of Alkenes to Trivalent Aluminium, Organometallics, 1990, 9, 2430-2436.
- ↑ P. Hassanzadeh, A. Citra, L. Andrews;Laser-Evaporated Aluminum Atom Reactions with Halogen Molecules, J. Phys. Chem. 1996, 100, 7317-7325

