2nd Year Inorg Comp(ekm17)
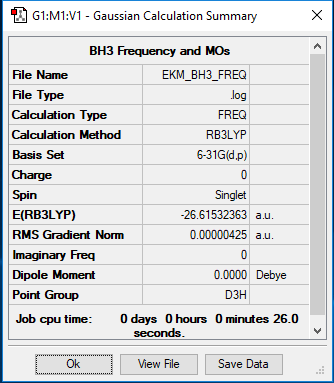
Analysis of BH3 using Gaussian (B3LYP/6-31G(d,p))
Summary table
'Item' table
         Item               Value     Threshold  Converged?
 Maximum Force            0.000012     0.000450     YES
 RMS     Force            0.000008     0.000300     YES
 Maximum Displacement     0.000064     0.001800     YES
 RMS     Displacement     0.000039     0.001200     YES
Frequency analysis log file
Low frequencies
 Low frequencies ---   -2.1192   -1.0709   -0.0054    2.3344   10.3048   10.3603
 Low frequencies --- 1162.9863 1213.1759 1213.1786
Jmol dynamic image
Optimised BH3 molecule |
IR Spectrum and Discussion
| Mode | Frequency | Infrared |
|---|---|---|
| 1 | 1162.99 | 92.5493 |
| 2 | 1213.18 | 14.0547 |
| 3 | 1213.18 | 14.0583 |
| 4 | 2582.31 | 0.0000 |
| 5 | 2715.48 | 126.3290 |
| 6 | 2715.49 | 126.3194 |
Ng611 (talk) 20:43, 29 May 2019 (BST) You need to provide an assignment for these vibrations.
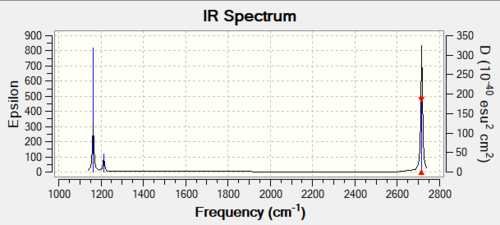
The above spectrum shows three distinct peaks, however there are 6 predicted vibrations. The reason for the appearance of only 3 peaks is due to there being 2 pairs of degenerate vibrations. Modes 2 and 3 are both bends, with the same frequency and very similar amplitudes. Similarly, modes 5 and 6 occur almost the same frequency and amplitude. They are both stretches. Finally, mode 4 is not observed on the spectrum because it has an IR intensity of 0.
Ng611 (talk) 20:44, 29 May 2019 (BST) Correct, although the intensity doesn't matter so much here.
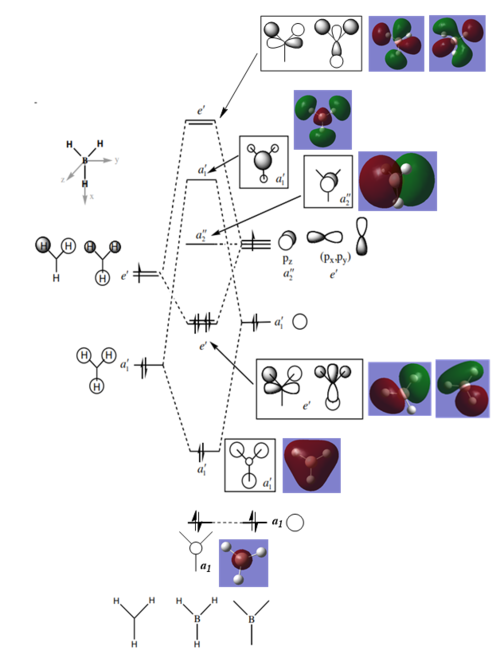
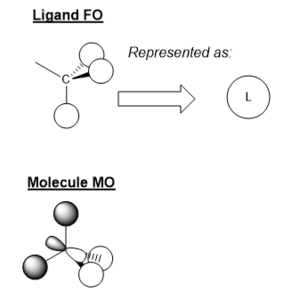
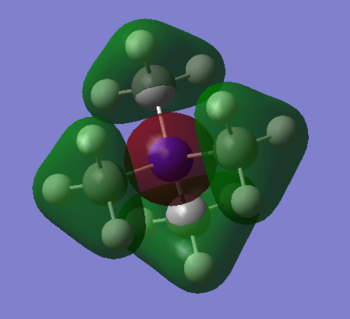
MO Diagram for BH3
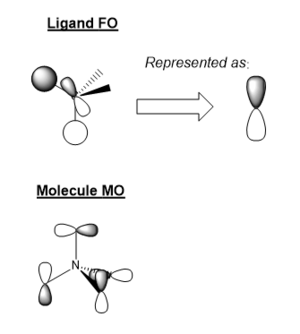
There some significant similarities between the LCAOs and computer generated MOs. While the 'real' MOs do not stay so rigidly within the given shape for p/s orbitals, they seem to be a slightly more diffuse 'average' of the LCAOs. This tells us that qualitative MO theory is a good approximation for the shape of MOs in reality. However, we cannot there are limitations and therefore we must use caution when backing up arguments with LCAOs.
Ng611 (talk) 20:45, 29 May 2019 (BST) Diffuse isn't really a significant differences. There are other ones that are far more significant.
Investigating Association Energies using Ammonia-Borane (B3LYP/6-31G(d,p))
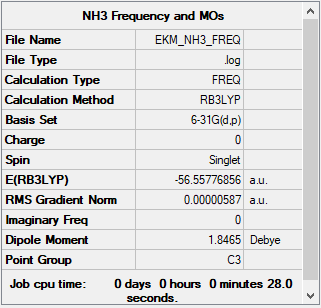
Summary table for NH3
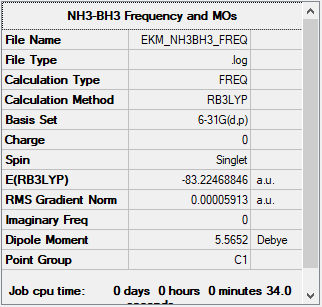
Summary table for NH3BH3
'Item' table for NH3
         Item               Value     Threshold  Converged?
 Maximum Force            0.000006     0.000450     YES
 RMS     Force            0.000004     0.000300     YES
 Maximum Displacement     0.000012     0.001800     YES
 RMS     Displacement     0.000008     0.001200     YES
'Item' table for NH3BH3
         Item               Value     Threshold  Converged?
 Maximum Force            0.000123     0.000450     YES
 RMS     Force            0.000058     0.000300     YES
 Maximum Displacement     0.000515     0.001800     YES
 RMS     Displacement     0.000296     0.001200     YES
NH3 log file
NH3BH3 log file
NH3 low frequencies
Low frequencies ---   -8.5646   -8.5588   -0.0047    0.0454    0.1784   26.4183
 Low frequencies --- 1089.7603 1694.1865 1694.1865
NH3BH3 low frequencies
Low frequencies ---    0.0008    0.0010    0.0011    8.4280   18.7605   41.6531
 Low frequencies ---  266.4501  632.1525  638.6866
NH3 Jmol
Optimised NH3 molecule |
NH3BH3 Jmol
Optimised NH3BH3 molecule |
Bond strength calculations
E(NH3)= -56.55777 au
E(BH3)= -26.61532 au
E(NH3BH3)= -83.22469 au
ΔE=E(NH3BH3)-[E(NH3)+E(BH3)] = -0.0516 au
-0.05163 au ---> -135.4758 kJ/mol
Ng611 (talk) 20:46, 29 May 2019 (BST) Too many d.p. here. Your values are accurate to ~ kJ/mol
By comparing the N-B bond enthalpy to both N-H and B-H bond enthalpies, we can see that it is significantly lower. This implies that the dative bond is relatively weak.
Ng611 (talk) 20:46, 29 May 2019 (BST) Cite your value!
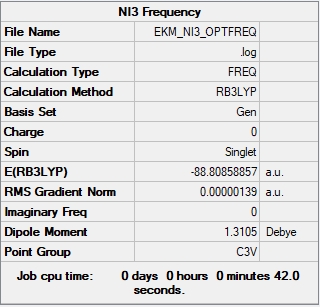
Creating a molecule of NI3 (B3LYP/6-31G(d,p)LANL2DZ)
NI3 log file
Summary table
'Item' table
    Item               Value     Threshold  Converged?
 Maximum Force            0.000002     0.000450     YES
 RMS     Force            0.000002     0.000300     YES
 Maximum Displacement     0.000022     0.001800     YES
 RMS     Displacement     0.000014     0.001200     YES
Low frequencies
Low frequencies ---  -12.5520  -12.5458   -6.0044   -0.0040    0.0191    0.0664
 Low frequencies ---  100.9969  100.9976  147.3377
Jmol dynamic image
Optimised NI3 molecule |
The optimised N-I distance is 2.18396
Ng611 (talk) 20:47, 29 May 2019 (BST) Again, too many d.p. 3 d.p for the bond length is fine.
Ionic Liquids: Designer Solvents
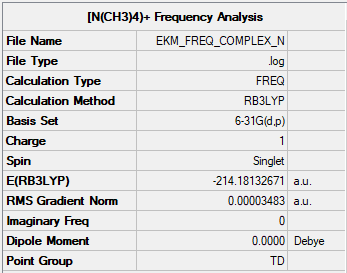
Optimisation and Frequency analysis of [N(CH3)4]+
Summary table
'Item' Table
Item               Value     Threshold  Converged?
 Maximum Force            0.000019     0.000450     YES
 RMS     Force            0.000004     0.000300     YES
 Maximum Displacement     0.000973     0.001800     YES
 RMS     Displacement     0.000260     0.001200     YES
Frequency analysis log file
Low frequencies
Low frequencies ---    0.0001    0.0008    0.0012   34.4293   34.4293   34.4293
 Low frequencies ---  216.3683  315.8252  315.8252
Jmol dynamic image
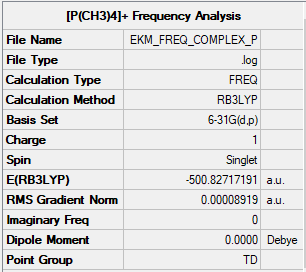
Optimisation and Frequency analysis of [P(CH3)4]+
Summary table
'Item' table
    Item               Value     Threshold  Converged?
 Maximum Force            0.000151     0.000450     YES
 RMS     Force            0.000034     0.000300     YES
 Maximum Displacement     0.000728     0.001800     YES
 RMS     Displacement     0.000280     0.001200     YES
Frequency analysis log file
Low frequencies
Low frequencies ---   -0.0024   -0.0023   -0.0023   51.3860   51.3860   51.3861
 Low frequencies ---  186.8196  211.6155  211.6155
Jmol dynamic image
NBO charge analysis
| Atom Species | Charge |
|---|---|
| N | -0.295 |
| C | -0.483 |
| H | 0.269 |
| Atom Species | Charge |
|---|---|
| P | +1.666 |
| C | -1.060 |
| H | 0.298 |
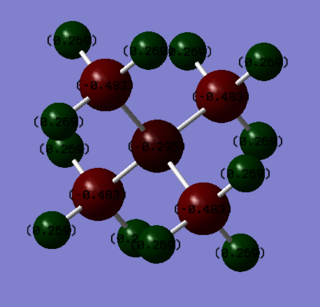
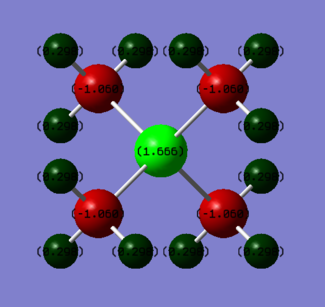
As displayed by the images and tables, the charge is not distributed equivalently within the two complexes. In the nitrogen complex, the N atom has a small negative charge, around half the charge on one of the carbon atoms. Each of the hydrogen atoms possess a small negative charge. In contrast, the phosphorous complex has a large positive charge on the P atom, a negative charge on each of the carbon atoms and a small positive charge on the hydrogens. The charge on the H atoms stays roughly the same, while the difference between the different central atoms is around 2, and the difference in charge on each of the carbon atoms within the complexes is around 0.6. This implies that the change in charge on the central atom is compensated for by the carbon atoms.
The discrepancy in charge carried by each of the central atoms is due to the difference in electronegativity of the central atoms. Nitrogen has an electronegativity of around 3, while phosphorous has one of around 2.2. This means that the C-N bond will be more polar than the C-P bond, and therefore electron density will be greater around the nitrogen than the phosphorous. As a result, the phosphorous has a strong positive charge assigned to the atom, while according to the NBO analysis the nitrogen has a negative charge assigned to it.
Ng611 (talk) 20:49, 29 May 2019 (BST) You also need to discuss the effect of symmetry.
The traditional description for the [N(CH3)4]+ complex has the formal positive charge assigned to the nitrogen atom. Based on the above findings, this is not consistent with reality. The charge analysis performed using Gaussian found the majority of the positive charge to be held by the hydrogen atoms, while the nitrogen atom holds a small negative charge, and the carbon atoms holding the greatest amount of negative charge.
Ng611 (talk) 20:49, 29 May 2019 (BST) Why does this discrepancy arise?
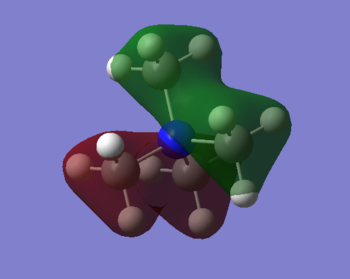
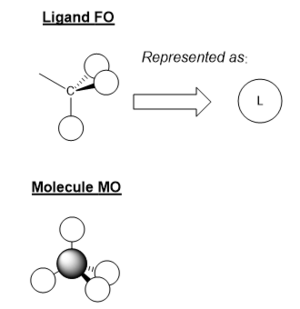
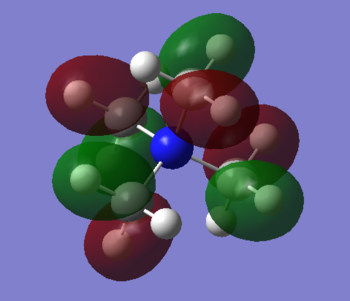
MO Representation
MO 7
Ng611 (talk) 20:50, 29 May 2019 (BST) Good! Perhaps label some of the interactions as well!
MO 10

