01572192 Rxn Dynamics
H + H2 system
Transition state
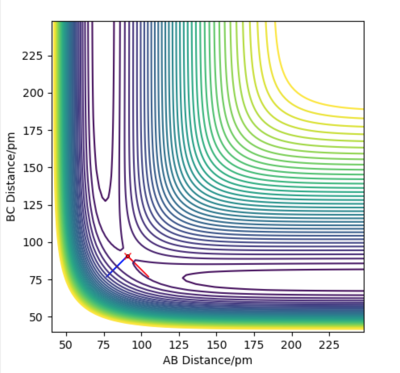
The transition state is mathematically defined as the saddle point on the potential energy surface diagram as the transition state lies at an energy maximum along the minimum energy pathway from the reactant to the product. The saddle point is a stationary point and its first partial derivatives are 0. Also, in the second partial derivative test, H is smaller than 0 for a saddle point, where H = fxx(x,y) fyy(x,y) - [fxy(x,y)]2. In other words, the second partial derivative is positive with respect to one direction and negative with respect to another.
Ok, but you could do with including the actual equations, otherwise description is correct. Rs6817 (talk) 12:56, 4 June 2020 (BST)
Using the simulation, values of approximately 0 kJ mol-1 pm-1 for the forces indicate a stationary point and by having a positive and a negative value for ω2 as part of the Hessian eigenvalue, the transition state can be identified. By obtaining 2 values for ω2, one positive and one negative, it indicates that a particular point is a maximum with respect to one direction and minimum with respect to another, therefore confirming that it is a saddle point, and thus corresponds to the transition state. For a local minimum, the ω2 values will show 2 positive values as the curvature from a local minimum is positive in all directions. Mathematically, a local minimum has H > 0 in the second partial derivative test discussed above and have positive second partial derivative values.

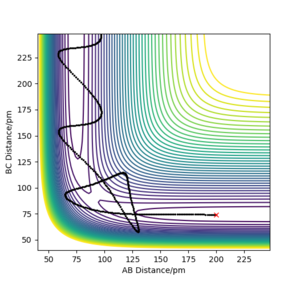
At the transition state, the 3 atoms are equally apart and AB=BC. The best estimate of transition state position rts is found to be 90.8 pm. As shown in Figure 2, the internuclear distance AB and BC are equal and remains constant over 50 fs. This shows that the trajectory is on the ridge and thus a good estimate of the transition state is obtained. On the other hand, if the system is not at the transition state, the "Distance vs Time" plot will show that the system undergoes an oscillatory motion with the AB and BC distances changing over time as the system oscillates about the position of the transition state along the diagonal of the contour plot shown in Figure 1. If the system is displaced from the transition state, it will roll downhill to an energy minimum given by either the reactants or the products. In that case, there will be an increase in the AC distance over time as the atom that is formed moves away from the molecule.
Fantastic answer, very well written and explained. Rs6817 (talk) 12:56, 4 June 2020 (BST)
Reaction path and dynamic trajectory
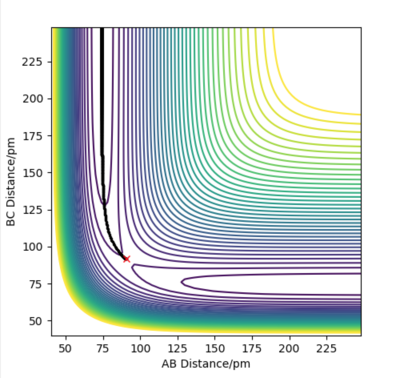
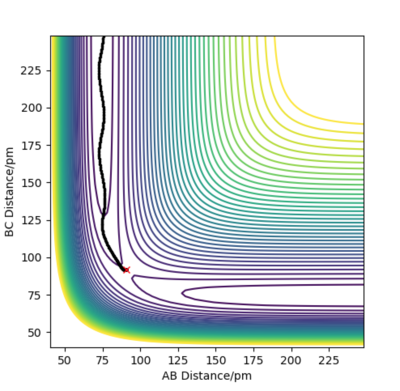
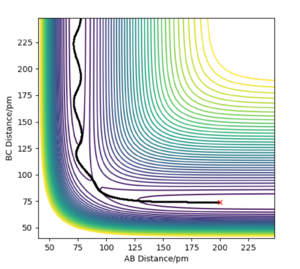
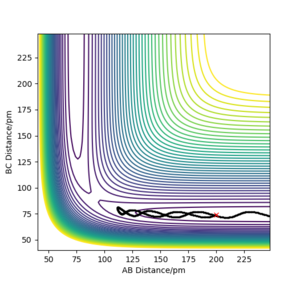
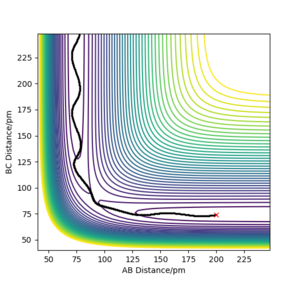
Figure 3 and 4 above illustrate the reaction path (minimum energy path, mep) and the trajectory from dynamic calculations respectively when the system is slightly displaced from the transition state. BC= rts +1 pm and AB = rts is used. In the mep, the trajectory follows the valley floor and no oscillation of the molecule AB is observed. This is because the momenta in each step is being set to 0. For the dynamic calculation, the trajectory shows an oscillatory behaviour as the distance AB varies along the trajectory.
Well explained. Rs6817 (talk) 12:59, 4 June 2020 (BST)

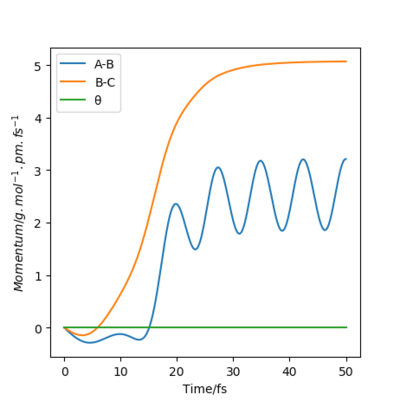


When the system is displaced in the opposite direction, where BC= rts and AB = rts + 1 pm, the shape of both the "Internuclear distance vs Time" and the "Momentum vs Time" plots remained the same. However, BC and AB distances and momenta are now represented by different lines on each of the graphs as seen in Figures 5-8. Initially, when BC is displaced from rts (BC= rts +1 pm), the system forms molecule AB and atom C as indicated by the increase in BC distance over time while that of AB shows an oscillatory motion due to molecular vibrations which can be observed in both the distance vs time and the momentum vs time plot. As the calculation changes to AB = rts + 1 pm, the system forms molecule BC and atom A is displaced. As a result, distance AB increases with time while distance BC shows oscillatory motion. These 2 situations represent the reactant and the product state of the system and illustrates the move towards an energy minimum when the system is displaced from its transition state.
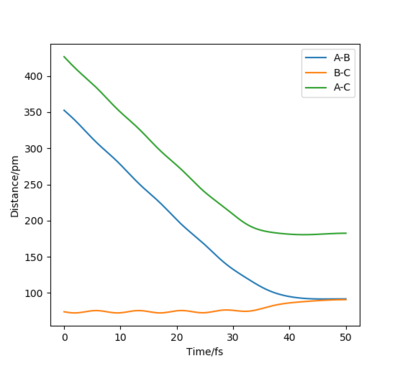
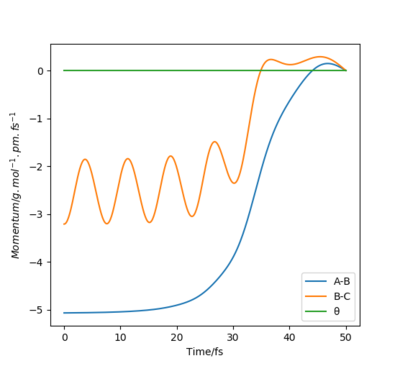
When initial positions of a calculation correspond to the final positions of a trajectory previously calculated and the same final momenta values are used but with their signs reversed, it was found that the new "Internuclear distance vs Time" plot generated is a mirror image of the previous plot about the internuclear distance axis. This is because both calculations are fundamentally based on the same process but with one being the reverse of the other. In one case, the atom is moving away from the molecule and in the other case the atom is approaching the molecule. However, the new "Momenta vs Time" plot is a reflection in both the momentum and time axes rather than just a mirror image. This is because, unlike distance, momentum is a vector quantity with direction, thus the signs of the momentum values need to change in the reverse process, causing the plot to be reflected about both axes.
Ok, but slightly too much information here / slightly confusing, the other part of the answer answered the question clearly. Rs6817 (talk) 13:00, 4 June 2020 (BST)
Reactive and unreactive trajectory
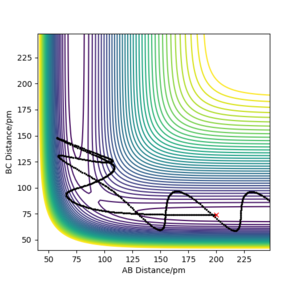
From the table, it can be concluded that whether a reaction occurs or not does not depend on the total energy of the system but how the energy of the system is being distributed. For example, comparing the last 2 examples in the table, despite the last example having a greater total energy, the energy is distributed differently than that of the penultimate example, hence the system was not able to recross the barrier, therefore leading to the formation of products.
Great table and well explained descriptions. Just be careful in the conclusion - the total energy DOES matter as well as the energy distribution. Good referring to your results in the table. Rs6817 (talk) 13:02, 4 June 2020 (BST)
Transition State Theory
As the transition state theory (TST) is based on a number of assumptions, the assumptions will influence the prediction of the reaction rate values, causing them to differ from experimental values. One assumption of the Transition State Theory is that systems that have crossed the transition state in the direction of products cannot reform reactants. However, in the table above, it was observed that barrier recrossing is possible. Thus, based on this assumption, the transition state theory overestimates the reaction rate. On the other hand, the transition state theory is based on classical mechanics and does not take into account quantum effects. For example, quantum tunnelling could occur leading to the formation of products and the lack of account for such phenomenon in the classical model underestimates the reaction rate. Nonetheless, the effect of quantum tunnelling is less significant as compared to the recrossing of the barrier to revert back to the reactants. Therefore, the transition state theory is more likely to overestimate the reaction rate.
Well done, erudite explanation. A reference may have pushed this answer slightly further, with ane xploration of the quasi - equilibrium Rs6817 (talk) 13:03, 4 June 2020 (BST)
F-H-H system
PES inspection and location of transition state
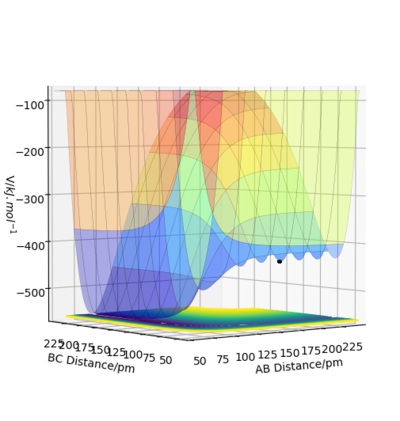
In this F-H-H system, A is F while B and C are H. From Figure 11, F + H2 reaction is exothermic while H + FH is endothermic. At large distance of AB, it represents the state of a F atom and a H2 molecule, while at a large distance of BC, it represents FH and H atom. As the F + H2 state is at a higher energy level, a reaction between F and H2 will lead to a lower energy product and therefore the reaction is exothermic. On the other hand, the reaction of H + FH involves the formation of higher energy products, hence the reaction would be endothermic.
H-F bond is stronger than H-H bond. When F reacts with H2, more energy is released from the formation of the H-F bond as compared to the energy required to break the H-H bond. There is a net release of energy from the reaction and hence the reaction is exothermic. For H + FH, the opposite process involves a net absorption of energy to break the strong H-F, thus the process is endothermic.
A reference for bond strength would help here. Be careful not to tread over the same points repeatedly. Rs6817 (talk) 13:05, 4 June 2020 (BST)
Using the simulation, it was found that the approximate position of the transition state involves a F-H (AB) distance of 180.6 pm and H-H (BC) distance of 74.5 pm. This was aided by the use of Hammond's postulate. According to Hammond's postulate, the transition state resembles the structure of either the reactant or the product depending on whichever is closer in energy to the transition state. In the reaction of F + H2, since the process is exothermic, the reaction involves an early transition state. As such, it can be deduced that the F-H distance in the transition state is larger than that of H-H.
Ok good, make it clear the method you used to determine this. Correct estimates and good invokation of Hammond Postulate - a reference may have aided, perhpas even literature values here for the experimentally determined bond lengths Rs6817 (talk) 13:05, 4 June 2020 (BST)
Activation Energy
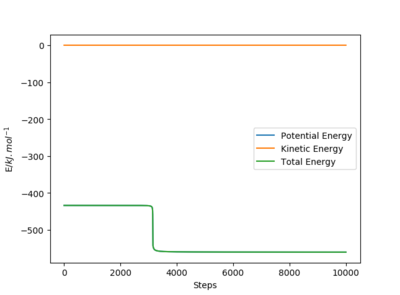
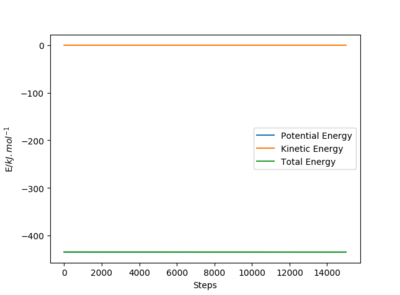
When the system is slightly displaced from the transition state, it will move towards either the reactants or products which are lower in energy. The activation energy can be found by taking the difference between the potential energy of the transition state and the reactant or product state. Using the mep, the activation energy is found to be 126.5 kJ mol-1 for the H + FH reaction and 0.90 kJ mol-1 for the F + H2 reaction. As the initial state is set such that the system is slightly displaced from the transition state, the values obtained would differ slightly from the true value of the activation energy. Furthermore, the number of steps used in the simulation affects the potential energy of the reactants and products obtained even though a sufficiently large number of steps is used, therefore there are errors associated with the activation energy obtained using this method.
Great answer, always try to refer directly to the figures in your text - i.e. which is endo / which is exo. Rs6817 (talk) 13:06, 4 June 2020 (BST)
Reaction Dynamics F + H2
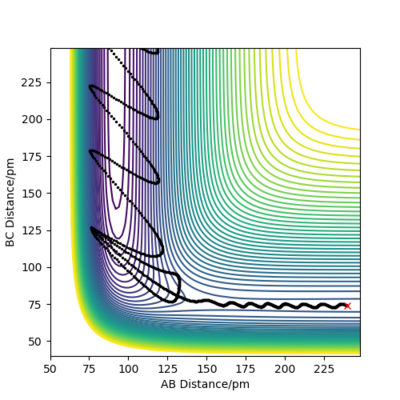
An example of a reactive trajectory is shown in Figure 14 for the reaction of F + H2. The initial conditions are rFH (AB) = 240 pm, pFH = -3 g.mol-1.pm.fs-1, rHH (BC) = 74 pm, pHH = -1 g.mol-1.pm.fs-1. When F reacts with H2 to form F-H and H atom, the potential energy of the system decreases. Given the conservation of energy, the loss in potential energy is converted into vibrational kinetic energy of the product molecule HF. This can be seen from Figure 14 whereby at small AB distance, there is large change in AB distance over time as the system moves down the exit channel, showing a high vibrational energy in the product molecule HF. Experimentally, the formation of higher vibrational energy HF molecule can be probed using IR spectroscopy. Two IR absorptions can be observed in vibrationally excited molecules of HF as a result of the transition from the ground state to the first vibrational excited state, as well as the transition from the first excited state to the second excited state. In contrast, ground state HF molecules will only produce 1 absorption peak due to the transition from the ground state to the first excited state. Another possible way of detecting the vibrationally excited HF is with the use of Infrared Chemiluminescence. In this technique, infrared emission from the excited HF molecule is measured as it decays back to the vibrational ground state.
Good Rs6817 (talk) 13:11, 4 June 2020 (BST)

The initial condition is set at rFH = 240 pm, rHH = 74 pm, with a momentum pFH = -1.0 g.mol-1.pm.fs-1. When pHH is varied from -6.1 to 6.1 g.mol-1.pm.fs-1, it was found that the trajectory is only reactive near the limits of the range around -6.1 g.mol-1.pm.fs-1 (Figure 15) and 5.9 g.mol-1.pm.fs-1 despite the system having more energy than the activation energy needed for the reaction. This suggests that the translational energy and vibrational energy do not contribute equally to the efficiency of reaction. Furthermore, it is worth noting that even at the limits of the range, not all values close to the limit give rise to a reactive trajectory as barrier recrossing might occur. For example, the case of pHH = 6.1 g.mol-1.pm.fs-1 is shown below in Figure 16 where an unreactive trajectory is obtained due to barrier recrossing.
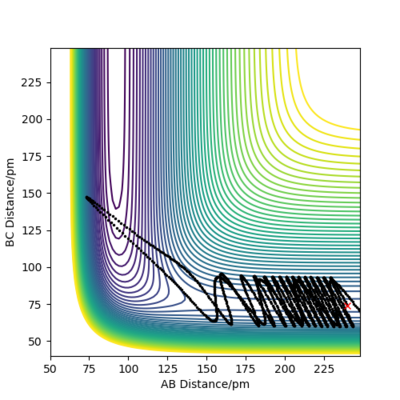

At the same initial position as previously but with a change in momentum where pFH = -1.6 g.mol-1.pm.fs-1 and pHH 0.2 g.mol-1.pm.fs-1, a reactive trajectory is obtained in Figure 17 even though the overall energy of the system has decreased significantly from -390.8 kJ mol-1 in Figure 16 to -432.9 kJ mol-1 in Figure 17.
Ok another good answer. For this question perhaps a table may have helped your presentation of the exploration. You are concerned primarily with whether the trajectory is reactive or unreactive, you have previously shown your ability to classify this in the H-H-H table. Rs6817 (talk) 13:11, 4 June 2020 (BST)
Reaction Dynamics F-H + H
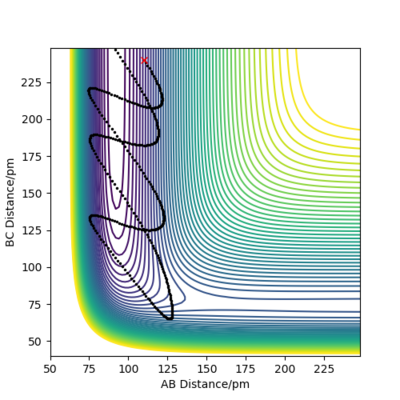
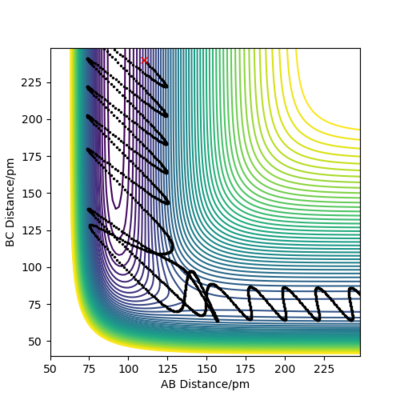
For an early transition state in the case of F + H2, increase in energy of the translational motion increases the efficiency of reaction. Between Figure 16 and 17, the momentum pHH is significantly reduced, indicating a reduction in the vibrational energy of the H2 molecule whereas the magnitude of pFH is increased, showing an increase in translational energy. A reactive trajectory is obtained in Figure 17 when the translational energy is increased while the vibrational energy is decreased, illustrating that the translational energy is more important for an early transition state reaction. On the other hand, in the reaction of F-H with H, it involves a late transition state and vibrational energy has a larger influence on the efficiency of the reaction. The initial conditions for FH + H is set to be rFH = 110 pm, rHH = 240 pm, pFH = 4.0 g.mol-1.pm.fs-1 and pHH = -8.0 g.mol-1.pm.fs-1 in Figure 18. As pHH is decreased from -8.0 to -2.0 g.mol-1.pm.fs-1 while pHF is increased from 4.0 to 11.0 g.mol-1.pm.fs-1 in Figure 19, the momentum of the H atom is reduced and the translational energy of the system is lowered, while the vibrational energy of H-F is increased. As a result, a reactive trajectory is obtained as shown in Figure 19. Hence, for a late transition state, the vibrational energy has a larger contribution to the efficiency of the reaction. This observation aligns with Polanyi's empirical rules which state that in an exothermic reaction, translational energy is more effective in crossing the barrier than vibrational energy, and vice versa for an endothermic reaction. The reason for this observation is that in an exothermic reaction with early transition state, high vibrational energy only allows the molecule to vibrate from side to side but does not provide enough energy to allow the molecule to cross over the barrier. On the other hand, in an endothermic reaction with late transition state, vibrationally excited molecules can cross the barrier while molecules with high translational energy will simply hit the repulsive inner wall of the potential surface and bounce back to the entrance channel.
Ok good answer, just make it clear where your references apply within the main text. I tihnk a few more reactive trajectories would have affirmed this conclusion - with regards to the previous section - again a table may have helped organise the message here. Rs6817 (talk) 13:13, 4 June 2020 (BST)
This is a really strong report, well done and minimal comments required to improve. Rs6817 (talk) 13:13, 4 June 2020 (BST)
References
1. J. I. Steinfeld, J. S. Francisco, W. L. Hase, in Chemical Kinetics and Dynamics, Prentice-Hall, 1998, ch. 10, pp. 289-290.
2. K. J. Laidler, in Chemical Kinetics, Harper-Collins, 3rd ed., 1987, ch. 12, pp. 460-466.
3. I. N. Levine, Physical Chemistry, McGraw-Hill, 6th ed., 2009, ch. 22. pp. 880-892.
4. J. C. Polanyi, Science, 1987, 236, 680-690.

