01564233wikireport
MOLECULAR REACTION DYNAMICS
Exercise 1: H + H2 system
Dynamics from the transition state region
Transition State
On a potential energy surface diagram, how is the transition state mathematically defined? How can the transition state be identified, and how can it be distinguished from a local minimum of the potential energy surface?
The Transition state on a potential energy surface diagram is the point in the minimum energy pathway that appears to be the maximum. In mathematical terms, it is the point on the curve where the first derivative of the potential (the gradient) is zero and the second derivative is smaller or larger than zero, i.e. ∂V(ri)/∂ri=0 or ∂2V(ri)/∂ri2 < 0, ∂2V(ri)/∂ri2 > 0. Transition state is a saddle point since it is both a maximum for the reaction coordinate pathway as well as a minimum to the pathway that is orthogonal to the reaction coordinate. Thus In order to distinguish the transition state from a local minimum we should prove that the point investigated is a saddle point since that means it must be a maximum in the direction orthogonal to which it is a minimum.
The force acting on the atoms in the transition state is zero and so is the Kinetic energy. All the energy is therefore potential. The transition state for the reaction between molecular hydrogen and atomic hydrogen is symmetrical thus the distance between the atoms is equal. In addition to that, since the momenta in transition state are zero if no change in the geometry is made, it remains still. However if we think of the transition state as the top of a cliff and with a ball, a small push of that ball could make it roll towards either the reactants or the products. Thus to locate transition states we could start the trajectories near TS and observe the direction it is going to (products or reactants).
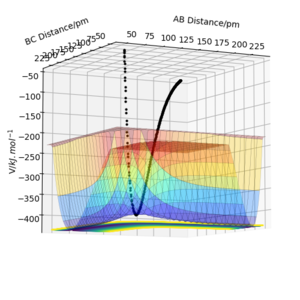
The partial derivatives in coordinates for the reaction and orthogoal to the reaction are 0. Rs6817 (talk) 16:55, 27 May 2020 (BST)
Report your best estimate of the transition state position (rts) and explain your reasoning illustrating it with a “Inter-nuclear Distances vs Time” plot for a relevant trajectory.
As mentioned previously the Transition state here is symmetrical and the atoms are equidistant. According to Hammond's postulate the transition state would resemble more either the reactants or the products depending on which it is closer in energy with. In this case it resembles both since the atoms used are the same.In order to easily spot the transition state, different initial conditions where used and the ones where the forces along AB and BC atoms where ~0 kj.mol-1.pm-1 were reported. The initial conditions were found to be rAB=rBC= 90.775 pm while p1=p2=0 kjmol-1.pm.fs-1 .
The plot of “Inter-nuclear Distances vs Time” is illustrated as well as the Contour plot. The “Inter-nuclear Distances vs Time” plot illustrates two straight lines that prove that the bonds AB and BC do not change in the transitions state thus the values found were correct. This is seconded by the fact that in the contour plot no trajectory is shown, just a point.
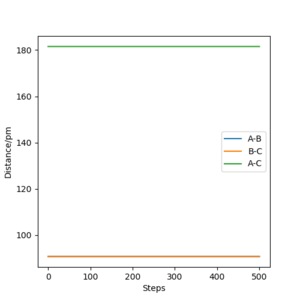
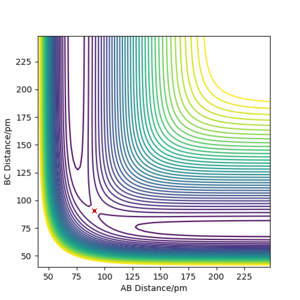
Great, well defined and explained. Its best practice to refer to figures numerically in the order of their apperance i.e. Figure 1 shows X. Figure 2 shows y. You can then title these whatever you like (as you have done). Rs6817 (talk) 16:55, 27 May 2020 (BST)
How do the mep and the trajectory calculated differ
In the MEP trajectory , the atoms are moving very slowly and they are on the minimum energy pathway possible for the reaction to take place. To calculate the MEP trajectory the system was displaced from the Initial transition state conditions by a very small amount (1 pm) . However, The trajectory calculated using calculation type Dynamics is different . The two, are illustrated below. Their difference is based on the fact that MEP is related to zero inertia in the molecules and no oscillation at all but the dynamic trajectory involves a small oscillation in the reaction pathway due to the presence of momentum. The dynamic trajectory is the actual trajectory


Ok, the MEP is fundamentally different in that the momenta is set to 0 with each step. What do the oscillations you described account for? Rs6817 (talk) 16:55, 27 May 2020 (BST)
Reactive and unreactive trajectories
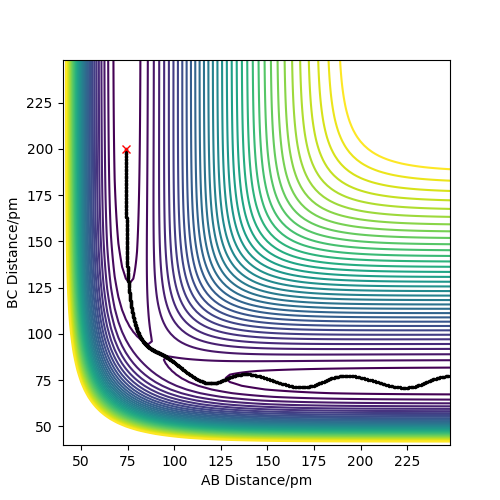
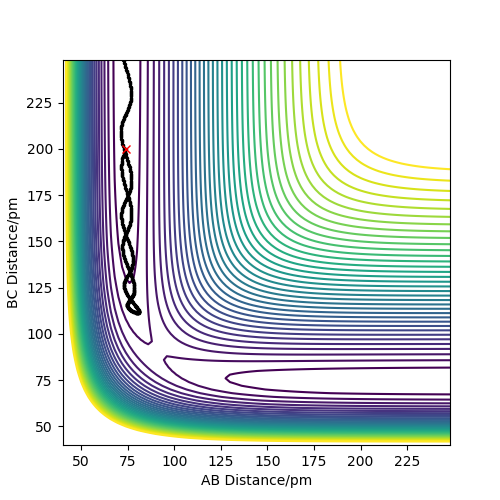
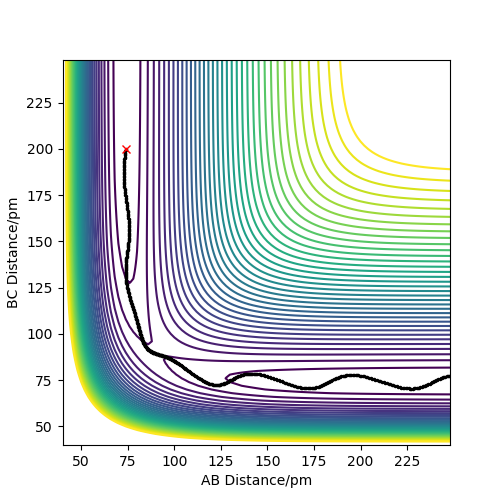
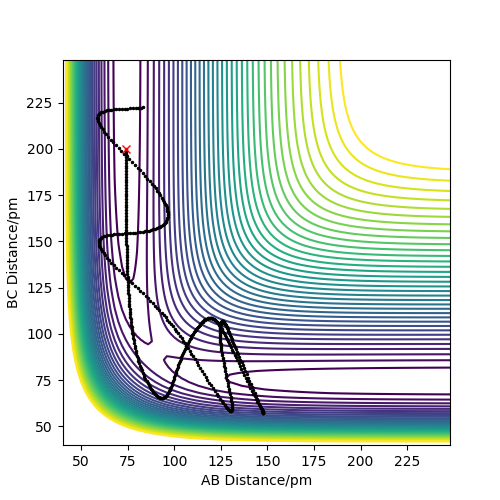
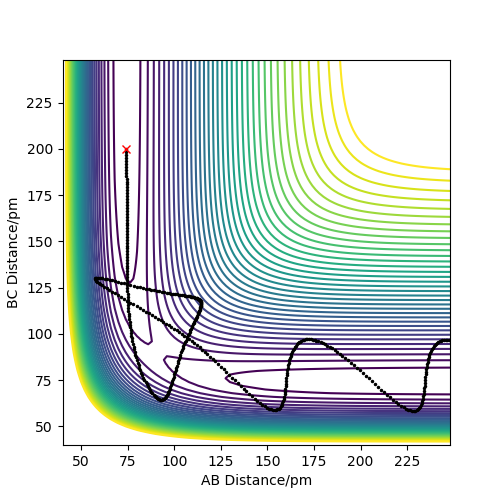
- The table below shows which trajectories are reactive or not using rAB= 74 pm, rBC= 200 pm but each time with different momenta
The PES trajectory shows the incoming atom Rs6817 (talk) 16:55, 27 May 2020 (BST)
Conclusion from the table :
Not all trajectories can be reactive. There are cases where the reactants have the right amount of kinetic energy to overcome the activation energy barrier and reach the transition state however due to their vibrational energy they can't form the products and reform the reactants.We can now see that not all the reactions that have same initial positions of atoms have the same results.
Correct conclusion but you could have referred to specific trajectories in your table to illustrate your conclusion. Rs6817 (talk) 16:55, 27 May 2020 (BST)
Transition State Theory
Given the results you have obtained, how will Transition State Theory predictions for reaction rate values compare with experimental values?
- Transition State Theory, is a theory that takes into account the structure of TS and the properties of the reactants to calculate the rate of a reaction. An assumption that transition state theory makes is that all reactions with kinetic energy larger than the activation energy lead to completion. As soon as the reactants reach the transition state they can't go back and be reformed. The only pathway from there is to go to the products. In reality however, even when the transition state is reached because there is sufficient energy, it is still possible that the reactants are reformed instead of the reaction going to products. This can be shown in the results obtained above where not all trajectories that reached transition state led to formation of products(e.g fourth row of the above table).Kinetic energy is of course one of the things to considerate while exploring a reaction but it is not the only one. Therefore, Transition state theory predictions overestimate the experimental values.
- Another assumption that is made from this theory is that everything can be treated classically, ignoring the quantum mechanics such as quantum mechanical tunneling. Tunneling in reality exists, but its effect is really small, and leads in slight underestimation of the real value of the rate, however since this effect is really small the transition state theory overall overestimates the true rate value. Furthermore the tunneling is inversely proportional to the mass of the atoms, thus it becomes even less important with increasing size of the atoms
- An additional assumption of the theory is that the Energy distribution is a Maxwell Boltzmann distribution and equilibrium theory may be used to find the concentration of the activated complexes
Great, well defined and explained but you could have included a reference as to where this information came from? Rs6817 (talk) 16:55, 27 May 2020 (BST)
Exercise 2:F - H - H system
PES inspection
By inspecting the potential energy surfaces, classify the F + H2 and H + HF reactions according to their energetics (endothermic or exothermic). How does this relate to the bond strength of the chemical species involved?
In the plots below, atom F is represented with A while the two H atoms are represented with B and C. The starting materials go through the transition state and they form the products.By inspecting the potential energy surface, we can see that there is a drop in energy going from reactants to products . In this case AB distance is the HF distance that's larger and BC is the H2 that is shorter, therefore reactants are H2 and F while products are HF and H. This indicates the exothermic nature of the reaction H-H + F → H-F + H (reactants higher in energy than the products) and at the same time the endothermic nature of the reverse reaction H-F + H → H-H + F. The bond strength of H-F is higher than that of H-H since more energy is released in its formation.
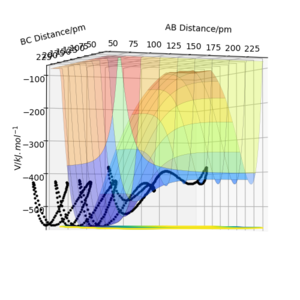
Locate the approximate position of the transition state.
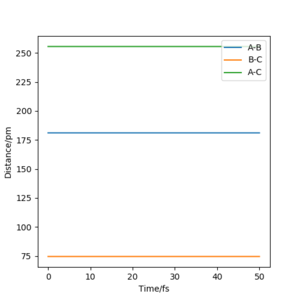
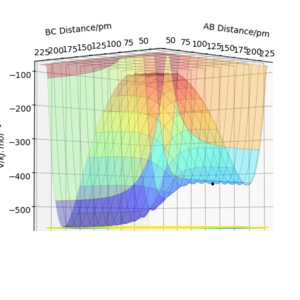
Hammond's Postulate states that the Transition state structure resembles more the structure of either the products or the reactants depending on which it is the closest in energy with. This indicates that for exothermic reactions the transition state resembles the reactants while in endothermic reactions it's product like. In this case the exothermic reaction is H-H + F → H-F + H and the TS will resemble H-H +F. Thus using Hammonds postulate as a guide, the same method as in exercise one was used to locate the transition state, however in this case the distance rAB is not equal to rBC since the Transition state would not be symmetrical and as mentioned above, would resemble H-H + F. What has helped in the process was looking at the contour plot and animation plot. No kinetic energy in transition state implies p1=p2=0 kjmol-1.pm.fs-1 while rAB is approximately 181.1 pm, rBC is approximately 75 pm
You needed a refernece here for Hammonds postulate. Referring to your figures will make things a lot clearer. Rs6817 (talk) 16:55, 27 May 2020 (BST)
Report the activation energy for both reactions
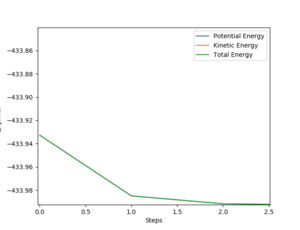
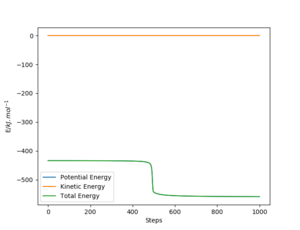
In order to estimate the activation energy for the reactions, a MEP calculation was used, with the number of steps increased, starting from a structure that is similar to the Transition state and varying it depending on the direction of the reaction by a very small amount
For the reaction H-H + F → H-F + H:
The exothermic nature of the reaction suggests that the activation energy required to form the transition state is small. After all, the TS already resembles the reactants and to overcome the energy barrier , a small amount of energy was needed. This was calculated and found to be 0.06 kJmol-1.
For the reaction H-F + F → H-H + H
The endothermic nature of the reaction suggests that the activation energy required to form the transition state is large and in order to form the products a lot of amount of heat/energy needs to be supplied to the system to overcome the barrier. This was calculated and found to be 110.219 kJmol-1.
The values are also slightly off from what I expected however I cannot assess how you calculated them. Rs6817 (talk) 16:55, 27 May 2020 (BST)
Reaction dynamics
In light of the fact that energy is conserved, discuss the mechanism of release of the reaction energy. Explain how this could be confirmed experimentally
One reactive trajectory for the reaction for F + H2, was found to be at rAB= 190 pm, rBC= 75 pm, pAB = -1 kjmol-1.pm.fs-1, prBC= -5 kjmol-1.pm.fs-1 The above reaction is exothermic thus energy in the form of heat is released into the system upon completion of reaction. By inspection of the contour plot we can see that the molecule H2 is approaching the Fluorine atom with intense vibration. Upon collision of the molecule with the atom, a bond is formed between the fluorine atom and the hydrogen resulting in HF molecule and atomic Hydrogen. The HF molecule is now vibrating more intensily than before. By looking at the Momenta vs Time plot we can observe that the total momentum of the system remains constant thus the total energy of the system is constant, but the kinetic and potential are alternating.
In this exothermic reaction energy can be released in two forms, either translational or vibrational.
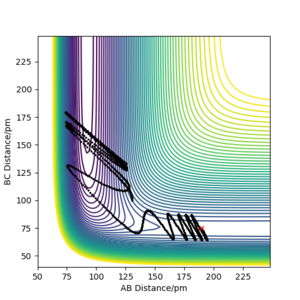
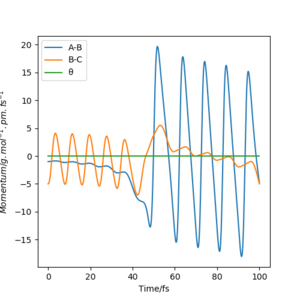
Since the reaction is exothermic in an experiment, the increase of temperature could be calculated using a calorimeter. However caloremetry calculates the total heat produced, and with that we cannot distinguish between Kinetic translational and Kinetic vibrational energy. To distinguish between the two we can use the IR technique in order to monitor the IR photons emitted from the vibrational relaxation. When energy is inserted to the system electrons get excited and move from the lowest vibrational state to a higher one. These electrons fall back to the ground state emitting photons that are monitored using IR technique. The process of emission of photons after electrons drop from higher vibrational energy levels to the ground state is called Fluorescence (Radiative decay)
Good description of techniques - bomb calorimetry woul be most accurate. Rs6817 (talk) 16:55, 27 May 2020 (BST)
Discuss how the distribution of energy between different modes (translation and vibration) affect the efficiency of the reaction, and how this is influenced by the position of the transition state.
Polanyi's empirical rules state that reactions according to their nature can become more efficient either by investing more in translational or vibrational energy. To determine which energy must be promoted more, the nature of the chemical reaction must be investigated using the Hammond's Postulate that was mentioned earlier. According to these, an exothermic reaction, i.e reaction where the transition state is early and resembles the reactants, is more successful by investing more translational energy rather than the vibrational. At the same time, for an endothermic reaction where the TS is late and resembles the products the reaction is more successfully promoted from higher vibrational energy.
The above can be verified by looking at the following plots. These describe the exothermic reaction of H-H + F → H-F + H.

The first plot shows a reactive trajectory. As it is observed , starting form the reactants and going through the channel, the TS is crossed and then we go to the products channel. From reactants to the transition state not many vibrations appear thus the translational energy is higher than the vibrational. However after overcoming barrier , from the TS to the reactants the vibrational energy is increased (oscillations are observed).

By looking at the other plot of the unreactive trajectory we can tell that if we start with a high vibrational energy, the reaction can't be completed. The opposite thing would be observed for the reverse reaction HF + H → H2 + F
A little more detail and exploration would have aided this answer, are Polanyis rules followed this strictly in the system? Perhaps some other momemnta combinations would have shown this. Good understanding and application otherwise. Rs6817 (talk) 16:55, 27 May 2020 (BST)
Bibiliography
- Atkins’ Physical Chemistry, P.W Atkins and J. De Paula 9th Edition, Oxford University Press
- J. Chem. Phys. 138, 234104 (2013); https://doi.org/10.1063/1.4810007
- Chemical kinetics by Laidler, Keith J
Good you have included these references but it is unclear where in the text they were used! Rs6817 (talk) 16:55, 27 May 2020 (BST)

