01522392
EXERCISE 1: H + H2 system
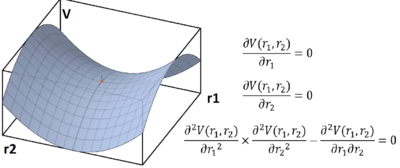
On a potential energy surface diagram, how is the transition state mathematically defined? How can the transition state be identified, and how can it be distinguished from a local minimum of the potential energy surface?
Mathematically, the transition state is defined as the saddle point of the potential energy surface. The saddle point is one of the three types of stationary points of 3D surfaces, the other two being minima and maxima. At these points, the partial derivatives with respect to x and y are zero. In order to distinguish saddle points from local minimums on the potential energy surface, one must compute the second partial derivatives fxx, fyy and fxy. If fxx*fyy-fxy2 >0, the stationary point is a saddle point. (Steiner, 2008)
Good description. Your point would be clearer if you referred to your graph and labelled it. Also, your reference isn't linked properly, your lab script could direct you to details on how to do this. Sf3014 (talk) 14:27, 29 May 2020 (BST)
Report your best estimate of the transition state position (rts) and explain your reasoning illustrating it with a “Internuclear Distances vs Time” plot for a relevant trajectory.
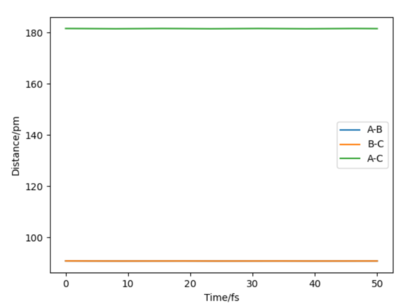
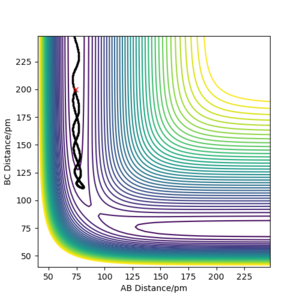
In order to locate the transition state, simulations with 0 initial momenta and identical positions were run. As the H + H2 surface is symmetric, the activated complex would not fall into either the reactant or product channels on the potential surface. However, the complex will oscillate when the positions given do not correspond to the saddle point of the potential surface as shown in figure 3. At interatomic distances of 90.8 pm, almost no oscillations occured. Thus the point (90.8pm,90.8pm) corresponds to the transition state.
Good but how accurate are your distances for the transition state? Did you round up to that value? If, yes show your accuracy, e.g zoom in on your distance vs time graph and refer to it in your description and state the accuracy (ie ± 0.001) based on the value given when the forces are zero Sf3014 (talk) 14:34, 29 May 2020 (BST)
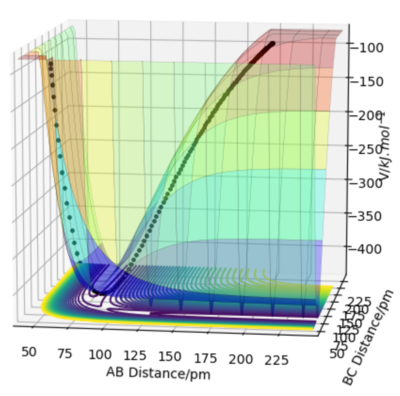
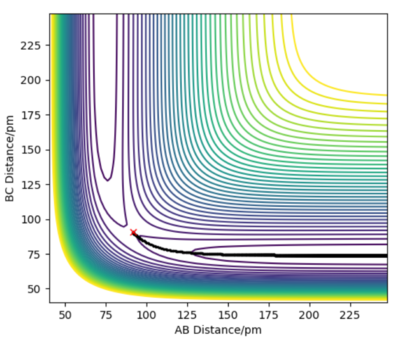
Comment on how the mep and the trajectory you just calculated differ.
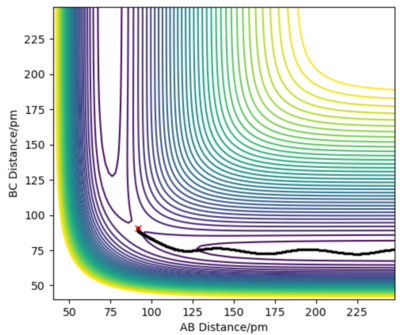
The MEP and dynamics trajectories differ in that only the latter exhibits low-amplitude internuclear vibrations in the product channel. The MEP trajectory stems from infintely slow motion and hence the kinetic energy cannot oscillate like it does during vibrations. In the dynamics calculation the atoms do not follow the minimum energy path but oscillates about it, preserving its total energy as potential energy drops
Your description is unclear, use the relevant evidence from the simulations you aim your description and refer to it. Also, compare evidence for both dynamic and mep calculations Sf3014 (talk) 14:37, 29 May 2020 (BST)
Complete the table above by adding the total energy, whether the trajectory is reactive or unreactive, and provide a plot of the trajectory and a small description for what happens along the trajectory. What can you conclude from the table?
Good layout. More clarity on how p1 and p2 relate to the AB and BC distances would be great and numbering the reactions will make referring to them in your conclusion clearer. Descriptions in table are not clear, e.g. when you talk about the lack of initial AB vibrations in the first reactive example, but the trajectory shows the movement of the C atom from the decrease in BC distance, so it seems like there is a lack of understanding here. Sf3014 (talk) 14:59, 29 May 2020 (BST)
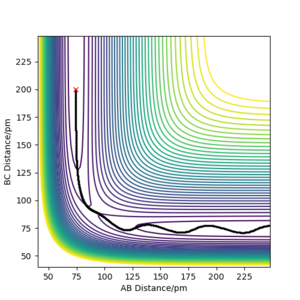
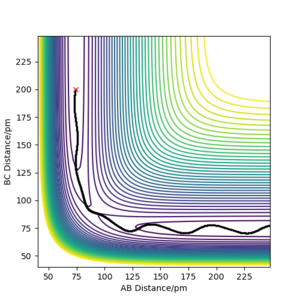
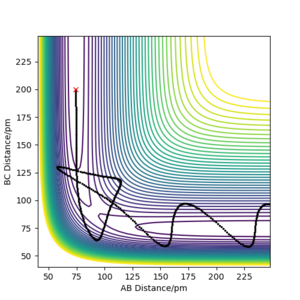
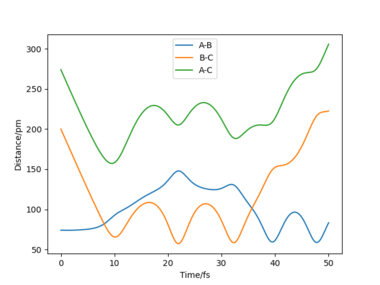
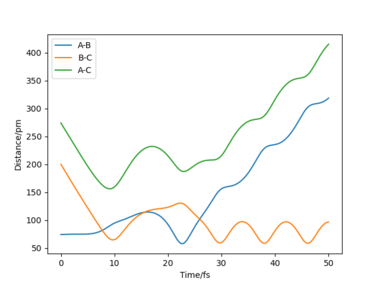
The table shows that for a reaction to occur, there is a minimum kinetic energy requirement. In the second simulation, the initial momenta are correct directionally but the total energy not high enough for the system to reach the transition state. In the other simulations the total energy is sufficient. However, simulation 4 is unreactive; the H-H bond breaks after the first oscillation of the product due to excessive vibrational energy, a process called barrier recrossing. This also occurs in simulation 5, but in this simulation the inital hydrogen molecule dissociates once again to give the product- crossing the potential energy barrier twice. These barrier crossings are illustrated by the figures below showing how the bonds form and break more than once.
Your conclusion is a little unclear but there is a good link to barrier recrossing and the use of distance vs time graphs to explain this. The lack of clarity from your statement of an "excessive vibrational energy". This is unclear because p1 and p2 are not defined with respect to the AB and BC distances, so it is unclear which kinetic energy is vibrational and which is translational in order to follow your description Sf3014 (talk) 14:59, 29 May 2020 (BST)
Given the results you have obtained, how will Transition State Theory predictions for reaction rate values compare with experimental values?
Transition state theory is based on 5 assumptions:
- Molecular systems cannot revert back to reactant molecules once the transition state col has been surmounted.
- The Maxwell-Boltzmann distribution can be used to find the energy distribution of the reactant molecules as well as the activated complexes that are converting to products, even though the whole system isn't in equillibrium.
- The motion of the system over the transition state col can be separated from the other motions associated with the activated complex.
- Chemical reactions can be treated in terms of classical motion over the barrier, ignoring quantum mechanical effects.
The result of the fourth simulation in the table above reveals that the first assumption of conventional transition state theory (CTST) has limited applicability. In this simultation, barrier recrossing results in no reaction even though the system did pass beyond the transition state barrier. The result of this error is that CTST predicts reaction rates that are too high; it erroneously counts collisions such as the one in simulation four in which barrier recrossing occurs as successful (Laidler [1], 1987).
The flaw of assumption 1 is adressed in variational transition state theory by varying the dividing surfaces which distinguishes the activated complex from reactants and products and choosing the surface position which gives the lowest rate. This brings the calculated rates closer to those obtained experimentally or by computational methods (Laidler [2], 1987).
Very good and clear description. You could also describe how the 5th assumption will affect the rate or if it is even a factor worth considering Sf3014 (talk) 15:05, 29 May 2020 (BST)
EXERCISE 2: F - H - H system
By inspecting the potential energy surfaces, classify the F + H2 and H + HF reactions according to their energetics (endothermic or exothermic). How does this relate to the bond strength of the chemical species involved?
Program 1
| Distance r1 / pm (BC) | Distance r2 / pm (BC) | Momentum p1 / g mol-1 pm fs-1 (BC) | Momentum p2 / g mol-1 pm fs-1 (AB) | Atom A | Atom B | Atom C |
|---|---|---|---|---|---|---|
| 40 | 230 | 0.0 | 0.0 | F | H | H |
Program 2
| Distance r1 / pm (BC) | Distance r2 / pm (BC) | Momentum p1 / g mol-1 pm fs-1 (BC) | Momentum p2 / g mol-1 pm fs-1 (AB) | Atom A | Atom B | Atom C |
|---|---|---|---|---|---|---|
| 40 | 230 | 0.0 | 0.0 | H | H | F |
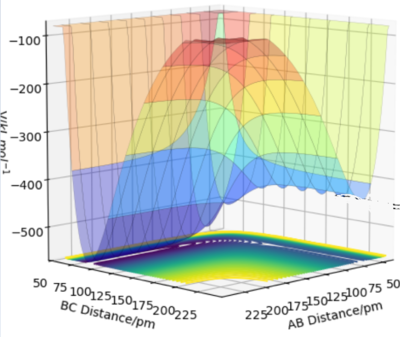
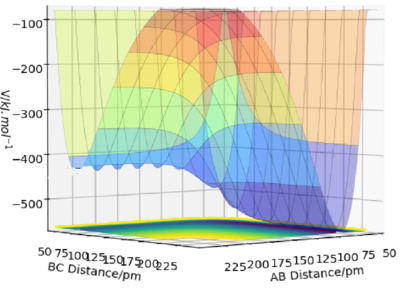
The figures above show the potential energy surfaces of the reactions H + HF and F + H2 respectively. The former is endothermic, as the potential energy of the HF + H reactant channel given by AB≈74 pm is substantially higher than in the orthogonal H2 + F product channel given by BC≈91pm. The second reaction is exothermic as the potential energy of the H2 + F reactant channel again is higher than the F + H2 product channel of the potential surface.
These observations correspond well with empirical bond strengths. The H-H bond strength is 436 kJ/mol and weaker than the H-F bond with strength of 568 kJ/mol due to the the ionic contribution to the bond arising from the difference in electronegativity between F and H.
Good but this is unclear. More clarity if you use your figure numbers in your description and labelled your graphs. Good use of bond energies, where did you get these values from? Sf3014 (talk) 15:11, 29 May 2020 (BST)
Locating the transition state
According to Hammonds postulate, the transition state of a reaction is structurally similar to states of similar energy. For example, endothermic reactions involve "late" transition states which are close in energy to the products and are hence structurally similar. In the case of exothermic reactions, the transition state is "early" and similar in energy to the reactants. This means that the transition state is structurally similar to the starting materials and close to the reactant channel on potential energy surfaces.
The transition state of the exothermic F + H2 reaction is thus expected to lie closer to the reactant channel than the product channel:
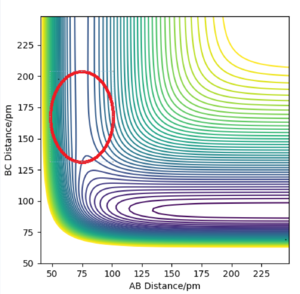
As the transition state is the saddle point of the potential energy surface, the gradient of postions near it will wither be directed towards the reactant or product channel. By running programs of initially stationary systems near the transition state, its location can be estimated as the point at which the trajectory directions switches. First, the BC coordinate was established, keeping the AB distance at 75 pm:
|
Distance BC / pm |
Trajectory direction |
|---|---|
| 160 | Product channel |
| 190 | Reactant channel |
| 180 | Product channel |
| 185 | Reactant channel |
| 181 | Reactant channel |
The table above shows that the BC coordinate of the transition state is about 180.5 pm. In order to find the AB corrdinate, the procedure was repeated but with BC held constant at 180.5pm.
|
Distance AB / pm |
Trajectory Direction |
|---|---|
| 75 | Product channel |
| 80 | Reactant channel |
| 77 | Reactant channel |
| 76 | Reactant channel |
Thus, the transition state position is approximately (75.5,180.5). The H + HF reaction is endothermic and will thus have a transition state close to the product channel on the potential energy surface. As this reaction is the reverse of the F + H2 reaction, the transition state will be the same in opposite coordinates;22@| approximateliy at BC=75.5 and AB=180.5.
Very good but refer to your image. It would be better if your showed the transition state position using your simulation, so the reader can see the stationary point for AB and BC distances Sf3014 (talk) 15:16, 29 May 2020 (BST)
Calculating the activation energy
The F + H2 reaction
By running a program with 0 initial momentum at the transition state, the total energy of the transition state can be obtained. In order to find the activation energy of the two reactions, the potential energy of the initial systems at equilibrium must also be calculated. This can be done by finding the limiting energy as the BC distance goes to infinity:
| Distance BC / pm | Total energy in kJ/mol |
|---|---|
| 180.5 | 433.819 |
| 200 | 433.869 |
| 250 | 434.365 |
| 350 | 434.684 |
| 500 | 434.722 |
| 700 | 434.724 |
| 1000 | 434.724 |
The activation energy of the F + H2 system is thus:
The H + HF reaction
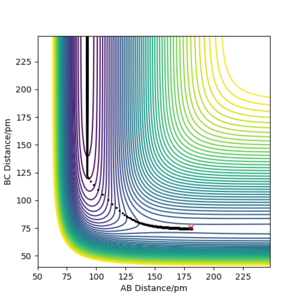
The activation energy of the endothermic reaction can be found in the same manner. As this potential surface is "repulsive" with a type 2 late transition state, the trajectory can't be followed easily by keeping AB constant. In stead, the H-H equillibrium distance of about 91.5 pm read from the contour diagram below is used to find the reactant channel energy as the BC distance goes to infinity.
| Distance BC / pm | Distance AB /pm | Total energy in kJ/mol |
|---|---|---|
| 180.5 | 75.5 | 433.819 |
| 700 | 91.5 | 560.627 |
| 1000 | 91.5 | 560.627 |
The activation energy of the H + H-F system is thus:
Very good, your workings are very clear but you can compliment your tables using graphs from your simulations too Sf3014 (talk) 15:20, 29 May 2020 (BST)
Reaction Dynamics
Program 3
| Distance r1 / pm (BC) | Distance r2 / pm (BC) | Momentum p1 / g mol-1 pm fs-1 (BC) | Momentum p2 / g mol-1 pm fs-1 (AB) | Atom A | Atom B | Atom C |
|---|---|---|---|---|---|---|
| 73 | 250 | -2.0 | -3.0 | F | H | H |
 |
 |
|---|
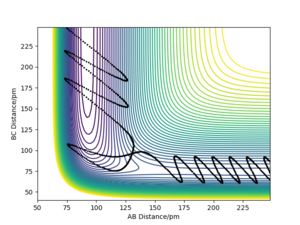
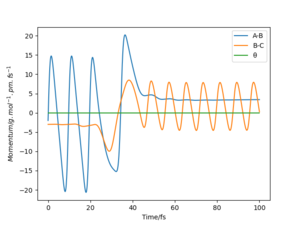
For all reactions, excess energy tend to be released in the form it had prior to the reaction. This effect is known as adiabaticity. For example, excess translational energy will be converted to translational energy in the products. In the simulation above, there is an excess energy of -392.0 kJ/mol –(-433.82kJ/mol)=41.82 kJ/mol giving rise to a more energetic activated complex than necessary for reaction to occur. The relaxation from this state of extended AB and BC bond distances results in a vibrationally excited product.
As shown in figure 11, the energy taken up for the reaction to occur is mostly vibrational. This is a general feature of endothermic bimolecular reactions with late-barrier surfaces, and explains why the translational energy is about the same in the reactant and product systems. It is likely that less energetic reactive initial states in which all vibrational energy is lost to increasing potential energy are possible. In program 3, the excess vibrational energy is converted to H-H vibrations in the product.
The fact that the H + HF reaction is driven by vibrational motion can be confirmed experimentally by comparing the vibrational frequency of H-F in the initial system to H-H in the product system.
Good but “program 3” is unclear (both r1 and r2 are defined as a BC distance) and your link to the “adiabaticity” is unclear, use your figure numbers in your description. Also, how are the vibrations measured? Sf3014 (talk) 15:44, 29 May 2020 (BST)
Discuss how the distribution of energy between different modes (translation and vibration) affect the efficiency of the reaction, and how this is influenced by the position of the transition state.
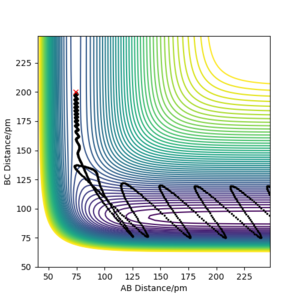
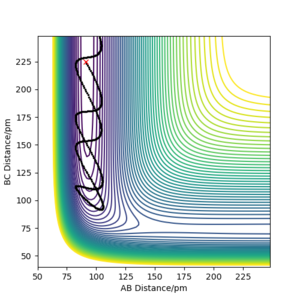
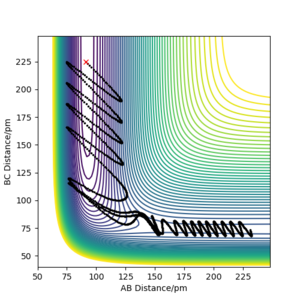
Polanyi's rules elucidate the importance of different forms of kinetic energy for promoting a bimolecular reaction depending on the nature of the transition state. If the reaction is exothermic with an early (type 1) transition state, translational and rotational energy is most important for promoting a successful reaction. If a reaction proceeds by a late transition state, the vibrational energy is most important, as is the case for the H + HF reaction discussed above. These two scenarios are extremes and most reactions involve transition states somewhere in between the two, with both translational and vibrational energy being converted to potential energy.
The F + H2 reaction is exothermic and has an early transition state with low energy. As expected from Polanskyi's rules, the translational motion is most important for reaction to occur. In fact, simulations showed that reaction could even happen with no vibrational energy at all. The situation is opposite for the reverse H + HF reaction which is promoted by vibrational motion in the reactant channel. The trajectories of these simulations are shown in the figures below and correspond well with Polanski's rules.
Good but your final paragraph is slightly unclear, what is type 1 and IST? Your graphs from your simulations were added to late to support your statement. Also reference Polanyi’s rules Sf3014 (talk) 15:44, 29 May 2020 (BST)
References
- Steiner, E. (2008). Functions of several variables. In Steiner, E., The Chemsitry maths book (pp. 253-258). Oxford: Oxford University Press.
- Laidler, K. [1] (1987). Conventional Transition State Theory. In Laidler, K., Theories of reaction rates (pp. 88-98). New York: Harper & Row.
- Laidler, K. [2] (1987). Assumptions and Limitations of Conventional Transition State Theory. In Laidler, K., Theories of reaction rates (pp. 115-123). New York: Harper & Row
- Laidler, K. [3] (1987). Reaction Dynamics. In Laidler, K., Theories of reaction rates (pp. 460-471). New York: Harper & Row

