01509561
Molecular Reaction Dynamics Report
by Sharifa Sheikh
this report was structured clearly and concisely. I think you have shown great understanding with your answers. I am pleased to see your lengthy and varied list of references. Well done! Mys18 (talk) 22:09, 1 June 2020 (BST)
Exercise 1
Q1. On a potential energy surface diagram, how is the transition state mathematically defined? How can the transition state be identified, and how can it be distinguished from a local minimum of the potential energy surface?
On a potential energy surface (PES) diagram, the transition state is mathematically defined as the saddle point. The transition state corresponds to the point of maximum potential energy on the minimum energy pathway.1
In order to identify a transition state, begin a reactant trajectory at the estimated transition state position, with zero momentum, and it should not move in any direction. To distinguish the transition state from a local minimum on the PES, change the trajectory parameters so that it starts close to the transition state, and the path should move away as it goes 'down' the PES, away from the maximum, and the potential energy decreases as it is converted to kinetic energy.
Good start. You are correcting in defining the TS as a saddle point, but mathematically what is this? Think about the first derivative backing up your next sentence. Will that equal 0? Slight more clarity needed, if it rolls towards the reactants/products that means it is a TS? Mathematically you could study the second derivative, a local minimum will give which a value > 0 or <0 always? whereas a TS will give a value >0 in one direction and <0 in the other (because it is a saddle point). Mys18 (talk) 21:40, 1 June 2020 (BST)
Q2. Report your best estimate of the transition state position (rts) and explain your reasoning illustrating it with a “Internuclear Distances vs Time” plot for a relevant trajectory.
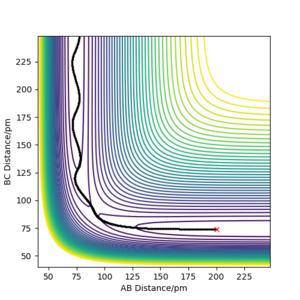
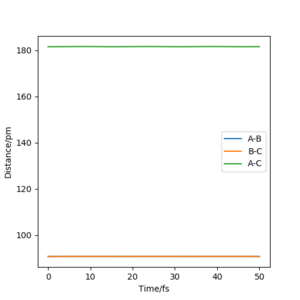
For the reaction, H + H2, the transition state position was found to be rts = 90.75 pm. Referring to the reactants, A is the incoming hydrogen atom; B and C are the two atoms in the hydrogen molecule. For the trajectory starting at the transition state, Figure 1 shows a graph of Internuclear Distance against Time. As can be seen, the lines for the distances A-B and B-C are flat, showing that as time progresses the atoms are not getting closer or further away from each other, but rather their internuclear distances remain constant. There is no gradient at the transition state, and the atoms have no momentum, so they remain in the same place.
Q3. Comment on how the mep and the trajectory you just calculated differ.
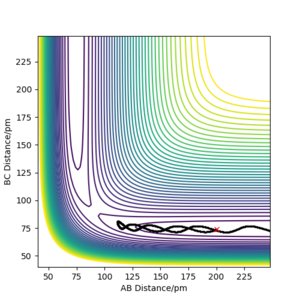
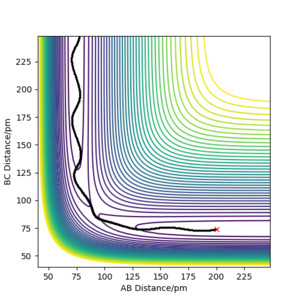
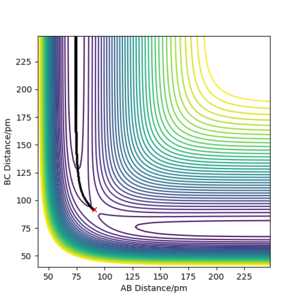
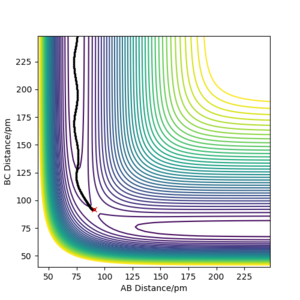
Below, Figures 2 and 3 show the results of two calculations with the same initial conditions. Figure 2 uses an MEP calculation type and Figure 3 uses a Dynamics calculation type.
Figure 2 shows the trajectory where at each step the momentum is reset to zero, meaning the path taken is that of the minimum energy, where the descent in potential energy is the steepest.2 This differs from Figure 3, which is a more realistic calculation as it does not reset the momentum. The trajectory shown in Figure 3 shows a more wavy path, corresponding to the vibrational energy in the molecule, resulting in oscillation of the atoms in the molecule.
Nice, maybe be more explicit in your point about the wavy trajectory; MEP trajectory is not as wavy because it does not consider the vibraitonal energy. Mys18 (talk) 21:47, 1 June 2020 (BST)
Q4. Complete the table above by adding the total energy, whether the trajectory is reactive or unreactive, and provide a plot of the trajectory and a small description for what happens along the trajectory. What can you conclude from the table?
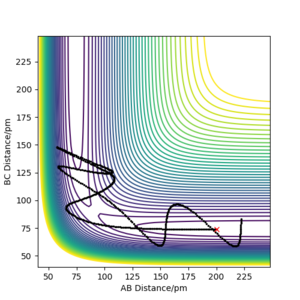
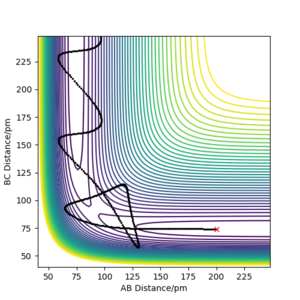
It has been concluded that trajectories with the following initial conditions are always reactive: r1 = 74 pm, r2 = 200 pm, with -3.1 < p1 / g.mol-1.pm.fs-1 < -1.6 and p2 = -5.1 g.mol-1.pm.fs-1. This is supported by the results of the trajectories in the first two rows of the table. The data in the table below (all table trajectories run with r1 =74 pm and r2 = 200 pm) shows that trajectories with the same positions but higher values of momenta are not necessarily reactive. The trajectory in the fourth row has higher values of momenta, and thus higher kinetic energy, but is unreactive. Although the reactants have enough energy to cross the energy barrier, the products re-cross it and return to reactants.
Q5. Given the results you have obtained, how will Transition State Theory predictions for reaction rate values compare with experimental values?
Transition State theory relies on a number of assumptions in order to predict the rate of a reaction. These assumptions include: the reactant molecules follow the Maxwell-Boltzmann distribution in terms of their energy distribution; even when there is no equilibrium present, the distribution of activated complexes forming products are still in accordance with the Maxwell-Boltzmann laws; quantum effects, such as quantum tunnelling, are ignored; motion in the transition state can be classically treated and separated from other motions; and, arguably the most crucial of assumptions, once reactants have passed through the transition state to form products, they cannot re-cross the energy barrier to reactants again.2,3
Overall, these assumptions result in the overestimation of reaction rate values, when compared to the experimental values. This is predominantly due to the assumption that once a system has crossed the energy barrier, it cannot re-cross and return to reactants. Therefore, if you have a certain number of barrier crossings, Transition State Theory assumes that 100% of these will result in a successful reaction and the formation of products. However, in reality, the proportion would be less than 100% as some systems would re-cross the barrier resulting in an unsuccessful reaction. Thus, the rate of the reaction would, in reality, be slightly less than the Transition State Theory prediction.
Perfect discussion. Mys18 (talk) 21:50, 1 June 2020 (BST)
Exercise 2
Q6. By inspecting the potential energy surfaces, classify the F + H2 and H + HF reactions according to their energetics (endothermic or exothermic). How does this relate to the bond strength of the chemical species involved?
The potential energy surface for F + H2 shows that the exit channel of the products is lower in potential energy than the entry channel of the reactants, so the reaction is exothermic. The potential energy surface for H + HF shows that the exit channel of the products is higher in potential energy than the entry channel of the reactants, so the reaction is endothermic. This means that H-F is a stronger bond than H-H, as the energy required to break H-H is less than the energy released when H-F is formed, in the case of F + H2, making it exothermic. In the case of H + HF, the reverse is true.
Great, this is a full answer to my liking. Are the H-H and H-F bond strengths as anticipated form your own chemistry bonding knowledge? Mys18 (talk) 22:02, 1 June 2020 (BST)
Q7. Locate the approximate position of the transition state.
The position of the transition state correlates to r1 = 74 pm and r2 = 181.4 pm (based on F + H2, r1 = rH-H and r2 = rF-H).
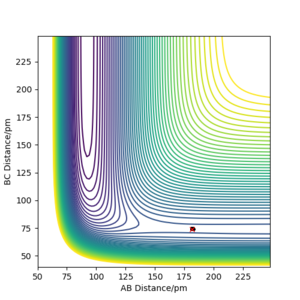
Q8. Report the activation energy for both reactions.
The activation energies are calculated by taking the difference between the energy at the transition state and the energy at the minimum of the reactant channel. The reactions F + H2 and H + HF are the reverse of each other so the activation energies will be different but the energy of the transition state will be the same.
F+H2, Ea = (-433.942) - (-435.100) = 1.158 kJ mol-1
H + HF, Ea = (-433.942) - (-560.700) = 126.758 kJ mol-1
Looks good.Mys18 (talk) 22:03, 1 June 2020 (BST)
Q9. In light of the fact that energy is conserved, discuss the mechanism of release of the reaction energy. Explain how this could be confirmed experimentally.
Energy is conserved in all reactions, but the energy distribution of the products is often different to that of the reactants. In the case of F + H2, the energy of the reactants is mostly in the form of translational kinetic energy; they have a small amount of vibrational energy. The products have a much larger amount of vibrational energy and less translational energy.
The reaction energy is released primarily through vibrational oscillation of the products and some translational kinetic energy. To confirm this experimentally, a method called infrared chemiluminescence can be utilised to examine the distribution of energy in the products. Infrared chemiluminescence is a technique that can be used to determine the vibrational state populations by studying the intensities of the infrared radiation emitted from vibrationally excited molecules.1
Q10. Discuss how the distribution of energy between different modes (translation and vibration) affect the efficiency of the reaction, and how this is influenced by the position of the transition state.
According to Polanyi's rules, an 'early' energy barrier, in the reactant channel, favours more highly vibrationally excited products. While a 'late' energy barrier, in the product channel, favours products with more translational energy. The energy distribution in the reactants, in conjunction with the position of the energy barrier, can affect how efficient a reaction is. Having more translational energy in the reactants when the transition state is 'early' leads to a more efficient reaction, but if the reactants were to have more vibrational energy, the reaction would be much less efficient and may not even be successful in forming products. Additionally, for a 'late' transition state, having more vibrational energy in the reactants leads to a more efficient reaction.4,5
Nice, you could go a step further and relate this your reactions, eg, the endo HF + H reaction with late TS can you interpret anything relating to the vibrational energy on the contour plots? Mys18 (talk) 22:08, 1 June 2020 (BST)
References
- P. Atkins, J. de Paula, and J. Keeler, in Atkins’ Physical Chemistry, Oxford University Press, Oxford, 11th edn, 2018, ch. 18, pp. 804-809
- K. J. Laidler, in Chemical Kinetics, Harper & Row, New York; London, 3rd edn, 1987, ch. 4, pp. 88-98
- J. I. Steinfeld, J. S. Francisco and W. L. Hase, in Chemical Kinetics and Dynamics, Prentice-Hall, Upper Saddle River, 2nd edn, 1989, ch. 10.1-10.3+10.10, pp. 287-321
- J. C. Polanyi, Acc. Chem. Res., 1972, 5, 161-168
- J. I. Steinfeld, J. S. Francisco and W. L. Hase, in Chemical Kinetics and Dynamics, Prentice-Hall, Upper Saddle River, 2nd edn, 1989, ch. 9.4.2, pp. 272-274

