01485762jy
EXERCISE 1: H + H2 system
Overall a good report - there are some minor issues that should be easy to fix. Fdp18 (talk) 11:55, 24 May 2020 (BST)
Question 1 (Dynamics from the transition state region):
On a potential energy surface diagram, how is the transition state mathematically defined? How can the transition state be identified, and how can it be distinguished from a local minimum of the potential energy surface?
Answer 1:
On a potential energy surface diagram, the transition state is defined mathematically as following: δV/δr1 = δV/δr2 = 0, where V is the chemical potential, r1 and r2 are the distances between atoms A & B and atoms B & C respectively.
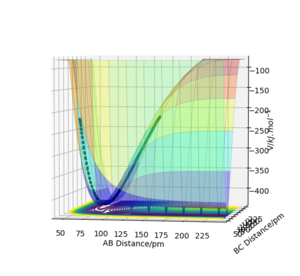
On a reaction co-ordinate diagram, where the minimum energy path (the line in bold in Figure 1) linking reactants and reactants is plotted, the transition state is the maximum (the one located at the least negative potential energy value). (Figure 1) On the potential energy surface diagram, it is a saddle point.
Check Figure 1 - it doesn't seem to show what you're talking about. Fdp18 (talk) 10:19, 24 May 2020 (BST)
Both the saddle point and the local minimum have the first derivative equal to zero, but they are distinguished by the following method. For the collision between three homogeneous atoms (in a symmetric case), the transition state is when rAB = rBC. Other turning points are classified as local maximum/minimum (depends on how you 'rotate' the diagram). Mathematically, for collisions between heterogeneous atoms, the term fxx(x0,y0)*fyy(x0,y0)−f2xy(x0,y0) has to be calculated, where fxx is the second derivative with respect to x, fyy to y and fxy is to differentiate with respect to x then to y where do you have this from? Also, the order of derivatives doesn't matter - see Schwarz's theorem. That's why you have only one term with mixed derivatives. Fdp18 (talk) 10:22, 24 May 2020 (BST)
. If the term is less than zero, then the coordinate a saddle point. If the term is greater than zero, then the coordinate is a minimum/maximum. For a local minimum, Its second derivative (fxx or fyy) has to be greater than zero.
Question 2 (Trajectories from r1 = r2: locating the transition state):
Report your best estimate of the transition state position (rts) and explain your reasoning illustrating it with a “Internuclear Distances vs Time” plot for a relevant trajectory.
Answer 2:
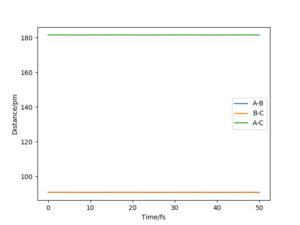
The best estimate of the transition state position (rts) is rAB=rBC=90.8 pm. The possible range of transition state is between 85 pm to 110 pm from the surface plot, so the values were tested in this range, keeping rAB=rBC and momentum zero. This result was verified by plotting the “Internuclear Distances vs Time” graph. Two straight horizontal lines at the same height were obtained, indicating the constant distances between A & B and B & C. There is no oscillations on the ridge.
It sounds like you used MEP to get the TS, which is a good idea. However, you won't see oscillations in any case there - ideally you would use the MEP to get the TS, and then verify it with a dynamics run (which will/should look the same) Fdp18 (talk) 10:26, 24 May 2020 (BST)
Question 3 (Calculating the reaction path):
Comment on how the mep and the trajectory you just calculated differ.
What is Figure 2 - is it a MEP or dynamics calculation? You don't refer to it in the text... Fdp18 (talk) 10:30, 24 May 2020 (BST)
Answer 3:
From the “Internuclear Distances vs Time” graphs generated by two methods, it is found that the distance between atoms A and B is higher in the Dynamics method and tend to infinity, whereas the distance generated by MEP tends to converge at a lower value. Therefore, it can be deduced that MEP is based on the conservation of energy whereas Dynamics ignores that. Also, there are some oscillations in distance B-C when using Dynamics, whereas MEP does not. So MEP ignores the motion of atoms and their inertia.
Two comments here. 1) I don't understand why the distance should "tend to infinity" - what do you mean by that? 2) I recommend you create a "total energy vs time" plot for both MEP and dynamics to show where energy is conserved. Fdp18 (talk) 10:29, 24 May 2020 (BST)
Question 4 (Reactive and unreactive trajectories):
Complete the table above by adding the total energy, whether the trajectory is reactive or unreactive, and provide a plot of the trajectory and a small description for what happens along the trajectory. What can you conclude from the table?
Answer 4:
| p1/ g.mol-1.pm.fs-1 | p2/ g.mol-1.pm.fs-1 | Etot | Reactive? | Description of the dynamics | Illustration of the trajectory |
|---|---|---|---|---|---|
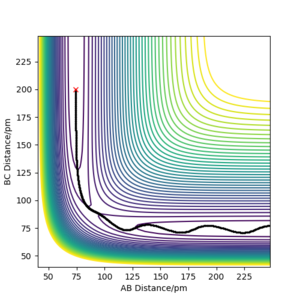
| -2.56 | -5.1 | -414.280 | Reactive | The H2 molecule(HA-HB) moves towards HC atom and the kinetic barrier is overcome, forming a new H2 molecule(HB-HC). The newly formed molecule vibrates away and HA also moves back. "away" and "back" are ambiguous - what is moving where relative to what? Fdp18 (talk) 10:31, 24 May 2020 (BST) |
 |
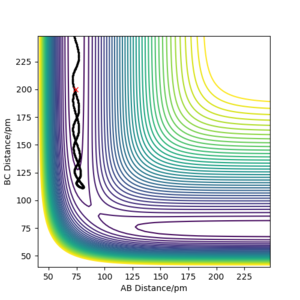
| -3.1 | -4.1 | -420.077 | Unreactive | The vibrating H2 molecule(HA-HB) moves towards Hc atom, but the energy was too low to pass the transition state region, so no reaction takes place; the H2 molecule(HA-HB) and HC vibrate backwards. |
 |
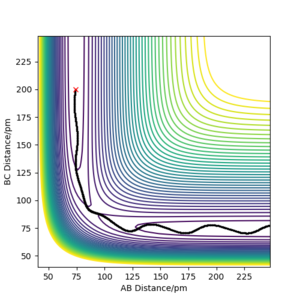
| -3.1 | -5.1 | -413.977 | Reactive | The vibrating H2 molecule(HA-HB) approaches HC atom and form a new H2 molecule(HB-HC). The new molecule vibrates away. You can keep "away" if you're more precise, such as "The newly formed molecule X moves away from the atom Y. After the reaction, molecule X shows vibration." Fdp18 (talk) 10:34, 24 May 2020 (BST) |
 |
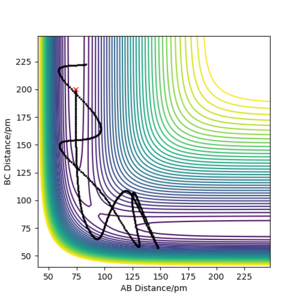
| -5.1 | -10.1 | -359.277 | Unreactive | The H2 molecule(HA-HB) moves fast towards HC. The transition state region was crossed. Due to the high momentum, HB bounces between HA and HC. Finally, HB reforms bonds with HA and the molecule vibrates backwards. |
 |
| -5.1 | -10.6 | -349.477 | Reactive | The H2 molecule(HA-HB) moves fast towards HC. The transition state region was crossed. Due to the high momentum, HB bounces between HA and HC. Finally, HB forms new bonds with HC and the new molecule(HB-HC) vibrates backwards. |
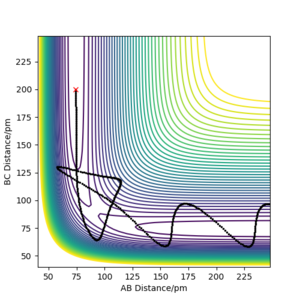 |
In conclusion, the momentum of the reactants is crucial in determining the success of reactions. If the momentum is too small, the energy barrier cannot be overcome and the trajectory is unreactive. If the momentum is too large, the transition state region can certainly be crossed, but the atoms may bounce around and the outcome is unpredictable, products are likely to be formed when one momentum is more than double of the other. From the above experimental data, the 'safest' p1 is around -3.1 g.mol-1.pm.fs-1 and p2 is -5.1 g.mol-1.pm.fs-1.
Question 5 (Transition State Theory):
Given the results you have obtained, how will Transition State Theory predictions for reaction rate values compare with experimental values?
Answer 5:
The transition state theory (TST) predicts a higher rate value than the actual experimental value gives. TST assumes that all the trajectories with the energy path along the reaction coordinates greater than the activation energy will be reactive, by ignoring the fact that atoms may 'bounce' around the transition state region. By looking at example 4 in the above table, atoms have enough energy but the reaction failed. In this case, TST failed. Also, even though the reaction can proceed under sufficient energy, the time taken for 'bouncing around' also reduce the actual rate constant (e.g. example 5), making TST overestimate the rate constant. I never even thought about the last part. It seems to be technically correct, but also bear in mind that the simulated reaction time is in the order of femtoseconds - and the impact on actual rate constants will be hard to measure. Fdp18 (talk) 10:37, 24 May 2020 (BST)
Please give references, in this case for TST. Fdp18 (talk) 10:40, 24 May 2020 (BST)
What you missed here is the possibility of quantum tunneling for light particles like hydrogen - how would that affect the reaction rate? Fdp18 (talk) 10:39, 24 May 2020 (BST)
EXERCISE 2: F - H - H system
Is there a particular reason you turned around the potential energy surfaces? I'm not complaining, but it is more natural with higher energies being at the upper end of a graph. Fdp18 (talk) 10:42, 24 May 2020 (BST)
Question 6 (PES inspection):
By inspecting the potential energy surfaces, classify the F + H2 and H + HF reactions according to their energetics (endothermic or exothermic). How does this relate to the bond strength of the chemical species involved?
Answer 6:
The reaction between F and H2 is exothermic and the reaction between H and HF is endothermic.
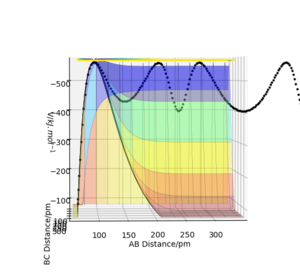
On the surface plot, the reactants H2 and F lie in a higher energy level than the products, so the reaction is exothermic. (Figure 3, with reactants on LHS and products on RHS).
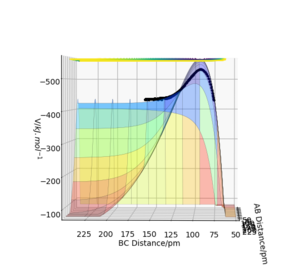
The reactants H and HF lie in lower energy level than the products, so it's endothermic. (Figure 4, with reactants on LHS and products on RHS)
reference for bond energies? Fdp18 (talk) 10:44, 24 May 2020 (BST)
| Bond dissociation energy at 298 K (kJ/mol) | |
|---|---|
| H-H | 436 |
| H-F | 569 |
For reaction between F and H2, H-F bond is newly formed and H-H is broken. It has a higher bond energy than H-H does, indicating more energy released, so the reaction is exothermic.
The reverse process takes place for reaction between HF and H, H-F is broken and H-H is formed. Therefore, more energy is absorbed to break the strong H-bond H-F and less energy released, so it is an endothermic reaction.
Question 7 (PES inspection):
Locate the approximate position of the transition state.
Answer 7:
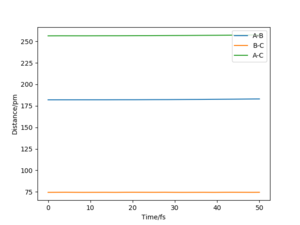
Different combinations of numbers were tried for distances until there is only one spot on the contour spot and the graph of "internuclear distance vs time" shows straight horizontal lines (Figure 5 & 6). For the reaction 1--H2+F, the position of transition state is at rH-H=74.4 pm and rH-F=182 pm.
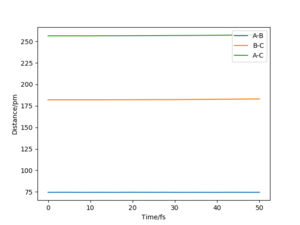
For reaction 2--HF+H, the position of transition state is at the same position, where rH-H=74.4 pm and rH-F=182 pm. This is because both the two reactions involve interactions between H-H and H-F, with only the differences in bond breaking/forming.
Question 8 (PES inspection):
Report the activation energy for both reactions.
Answer 8:
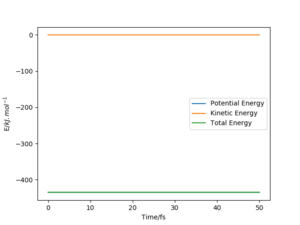
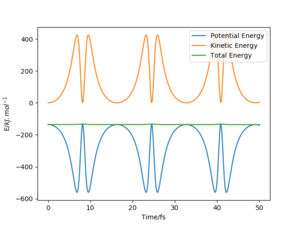
The activation energy is calculated as the difference between the potential energy of the transition state and the reactant. The respective energies are determined by plotting "Energy vs Time" graphs. As the transition state for both reactions are at the same position with the same structure of F--H--H, the two reactions have the same potential energy for the transition state, which is -433.980 kJmol-1 (Figure 7). For the potential energy of the reactants, it is assumed that the reactant species are not interacting, so the distance B-C is set near infinity and the most negative value of potential energy on the graph is taken as the potential energy of the reactants.
"near infinity" is ambigous here - it depends on the context. For the system here, even 1 mm could be considered "near infinity". What values did you choose? Fdp18 (talk) 11:46, 24 May 2020 (BST)
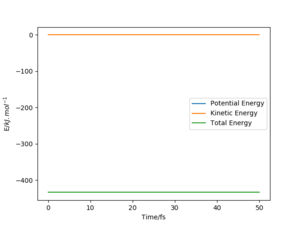
For reaction 1--H2+F, the potential energy for the reactants is -435.073 kJmol-1 (Figure 8), so the activation energy is 1.093 kJmol-1.
For reaction 2--HF+H, the potential energy for the reactants is -562.459 kJmol-1(Figure 9), so the activation energy is 127.386 kJmol-1.
Question 9 (Reaction dynamics):
In light of the fact that energy is conserved, discuss the mechanism of release of the reaction energy. Explain how this could be confirmed experimentally.
Answer 9:
The distance AB is set as 66 pm and distance BC is 210 pm. The momentum of AB is -9.1 g.mol-1.pm.fs-1 and that of C is -5.8 g.mol-1.pm.fs-1. Under this condition, the H2 molecule vibrates towards F atom, after bouncing around a few times, the HB atom forms bonds with F, and HF vibrates away.
In this process, based on the conservation of energy, the potential energy is converted to kinetic energy. The kinetic energy consists of vibrational and translational energy. The vibrational energy can be detected through infrared spectroscopy. To measure the heat change, a colorimeter can also be used to determine whether a reaction is endothermic or exothermic, by how much amount.
Question 10 (Reaction dynamics):
Discuss how the distribution of energy between different modes (translation and vibration) affect the efficiency of the reaction, and how this is influenced by the position of the transition state.
Answer 10:
For all reactions, A B are the atoms in the molecule and C is the atom for colliding. When pAB is set far more than pBC (pBC is also given a low value), the system is said to have a high vibrational energy (and a low translational energy). Oppositely, when pAB is set far less than pBC (pAB is also given a low value), the system is said to have a high translational energy (and a low vibrational energy).
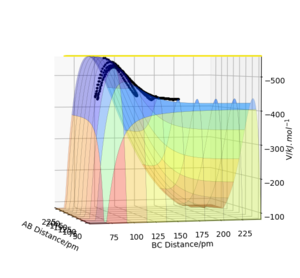
For reaction 1--H2+F, the positions are set at rAB=74 pm and rBC= 160 pm, momentum is pBC=-1 g.mol-1.pm.fs-1, the momentum pAB is tested in range between -6.7 to 6.7 g.mol-1.pm.fs-1. Under such high vibrational energy, it is hard to obtain a reactive trajectory, so reaction 1 is inefficient at a high vibrational energy and a low translational energy. However, when pAB is reduced to 0.2 g.mol-1.pm.fs-1 and pBC slightly increased to -1.6 g.mol-1.pm.fs-1, a reactive trajectory is obtained. Therefore, in case of a high portion of translational energy and a low vibrational energy, reaction is efficient.
It would be good if you provided exemplary trajectories for the four possible cases. Furthermore, the 3D plots below are difficult to interpret/see - contour plots with the trajectory drawn as continuous line would facilitate understanding what you did to the reader. Fdp18 (talk) 11:49, 24 May 2020 (BST)
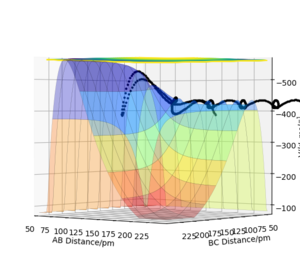
For reaction 2--HF+H, the same procedure is repeated. This time, the positions are set at rAB=182 pm and rBC= 60 pm. At high translational energy (high pBC) and low vibrational energy (low pAB), it is hard to obtain a reactive trajectory. When a high vibrational energy and a low translational energy is set, a reactive trajectory is obtained. (e.g. pAB=-5.6 g.mol-1.pm.fs-1,pBC=-1.0 g.mol-1.pm.fs-1) Therefore, reaction 2 is efficient under a high portion of vibrational energy and a low translational energy.
According to Polanyi's empirical rule, high translational energy would be more effective for reactions with an early transition state than vibrational energy; vice versa for reactions with a late transition state. This theory is supported by experimental results. Figure 10 shows the energy pathway for reaction 1. Its transition state is closer to the reactants (LHS), so it is an early transition state. Owing to this early transition state, reaction 1 is efficient when a large portion of translational energy is applied. Figure 11 shows the energy pathway for reaction 2. Its transition state is closer to the products H2 (RHS), so it is a late transition state. Owing to this late transition state, reaction 2 is more efficient when a large portion of vibrational energy is applied. All the experimental results fit the theory.
I assume by "experiment" you mean the simulation here. Usually, "experiment" refers to a practical experiment conducted in a laboratory rather than a computer simulation, although computer simulations do have characteristics that place them between a classical experiment and pure theory. Fdp18 (talk) 11:51, 24 May 2020 (BST)
References
It's good that you provide references here - however you need to use those in the text for them to "count". Fdp18 (talk) 11:52, 24 May 2020 (BST)
1.Yabushita, Satoshi. “Relativistic Effects on Transition State Structures and Properties: Transition State Spectroscopy of IHI and BrHI.” The Transition State, 2019, pp. 267–282., doi:10.1201/9780367810573-13.
2.Polanyi, J. C., and D. C. Tardy. “Energy Distribution in the Exothermic Reaction F H2 and the Endothermic Reaction HF H.” The Journal of Chemical Physics, vol. 51, no. 12, 1969, pp. 5717–5719., doi:10.1063/1.1672005.
3.Guo, Hua, and Kopin Liu. “ChemInform Abstract: Control of Chemical Reactivity by Transition-State and Beyond.” ChemInform, vol. 47, no. 33, 2016, doi:10.1002/chin.201633256.
4.Zhao, Bin, et al. “Communication: State-to-State Dynamics of the Cl H2O → HCl OH Reaction: Energy Flow into Reaction Coordinate and Transition-State Control of Product Energy Disposal.” The Journal of Chemical Physics, vol. 142, no. 24, 2015, p. 241101., doi:10.1063/1.4922650.
