01356570:physicalcomplab
For a three atom reaction, the potential surface is four dimensional. In the discussions below, the angle between the bonds is fixed to 180o, making the surface collinear to decrease the dimensionality to three. A potential energy profile for the three atom reaction is then plotted as a function of the internuclear distances, the reaction path in order to investigate a reaction of the H2 molecule with a H atom and with a F atom.[1]
Exercise 1: H + H2
Transition State
On a potential energy surface diagram, how is the transition state mathematically defined? How can the transition state be identified, and how can it be distinguished from a local minimum of the potential energy surface?
Transition state of a reaction occurs at the saddle point on a potential energy surface vs reaction coordinate diagram. This is the highest energy state that the reactants have to go through before turning into the products and so must produce a turning point that is maximum in nature. In the 3D diagram there are two planes and a saddle point is defined to be the point where following one of the plane results in a minimum whereas following the other one results in a maximum. In order to find the transition state, we are looking for the plane that gives the maximum.
At transition state all of the kinetic energy is converted to potential energy at that state, resulting in a 0 gradient at the point. The first step in calculation is finding the values for position, r that gives 0 when the first derivative of potential energy, V(r) is taken with respect to the Cartesian coordinates. The calculated r values are then introduced into the second derivative of V(r). A negative value of second derivative means that the r value corresponds to a maximum whereas a positive value shows that the r value is where the minimum of the potential energy is located on the graph. As a result, the negative value will indicate the location of transition state at that position.[1]
Good, I think you've understood the concept. Sw2711 (talk) 14:44, 3 June 2019 (BST)
Report your best estimate of the transition state position (rts) and explain your reasoning illustrating it with a “Internuclear Distances vs Time” plot for a relevant trajectory.
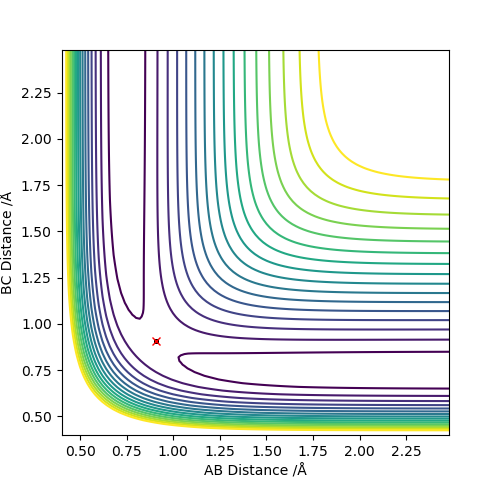
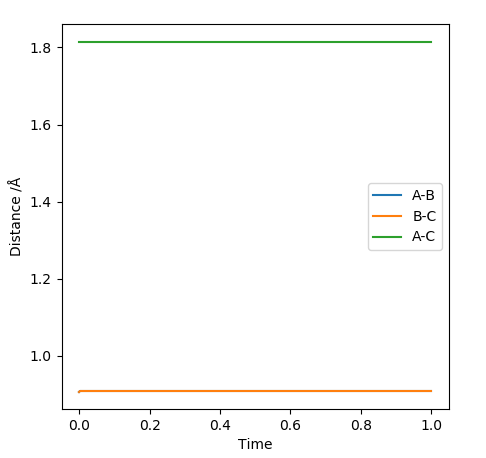
The reaction between the HA atom and the HB-HC molecule occurs on a symmetric surface. This means that at the transition state the internuclear distances between the consecutive atoms will be the same; rAB=rBC. The below graph shows where the transition state is located for the reaction.
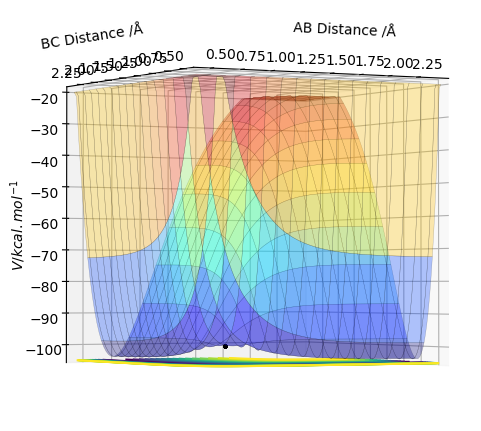
In order to locate the saddle point, r values ranging between 0.78 and 1 A were used for experimentation. Since the equilibrium bond length for a Hydrogen molecule is 0.74 A, and since an elongation of the bond is expected at the transition state, a value bigger than that was chosen. The limit was chosen such that the molecule and the atom were close enough such that HA atom and the HB atom of the molecule would result in a bond with a length of 0.74 A after crossing over the transition state barrier. After experimenting with the values, it was found that the maximum energy occurred when rAB=rBC= 0.90774 A. All the trials were carried out by equating the two momenta parameters to 0. When all of the kinetic energy is converted to potential energy and the species are sitting on a maximum with no momentum, the species stay at that point resulting in no reaction trajectories.
This part is good. Sw2711 (talk) 14:44, 3 June 2019 (BST)
MEP and Dynamics Calculations
Comment on how the mep and the trajectory you just calculated differ This part is good. Sw2711 (talk) 14:45, 3 June 2019 (BST) The trajectories below were calculated such that the distance between the the atoms which used to be a molecule was increased to 0.91774 A and the distance where a new bond will form was kept at the transition state position, 0.90774 A with 0 momenta. This means that the elongation of the former bond increased and the transition state is crossed over. The reaction path is now downhill and so the products are expected to be formed. This formation could be verified by two different algorithms.
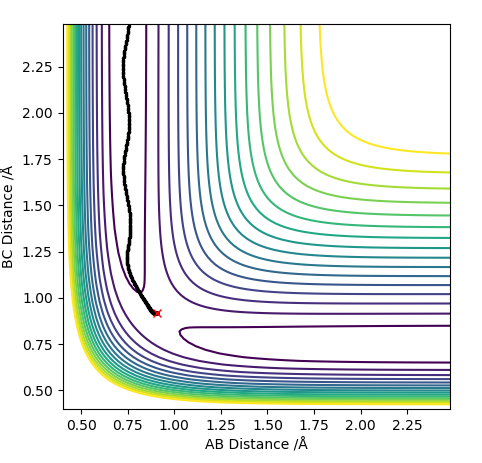

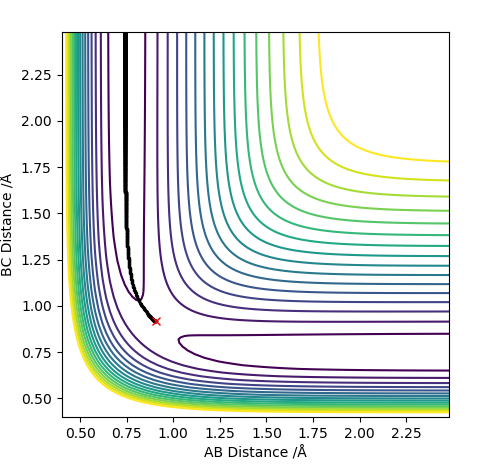
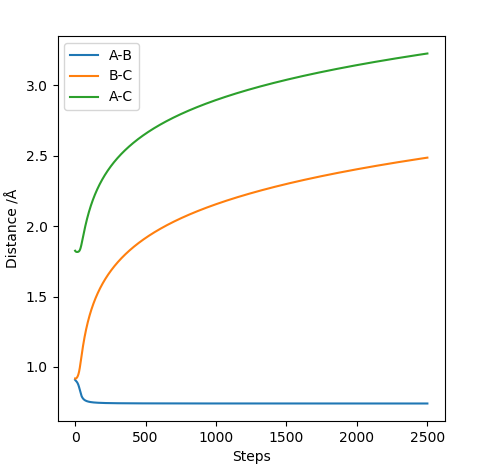
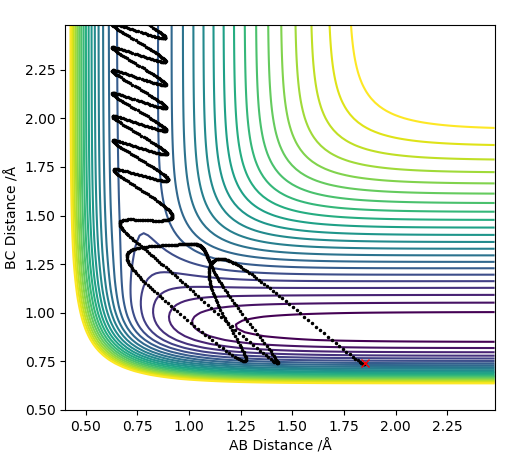
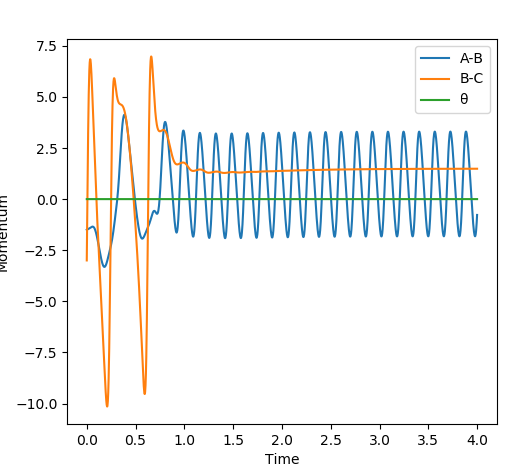
MEP (minimum energy path) and dynamics were the two algorithms used to observe the trajectory of the reaction. MEP produces a trajectory such that it corresponds to infinitely slow motion. In MEP calculation of the trajectory, it could be seen that the product has no change in its internuclear distance as time progresses, producing a straight line, whereas waves corresponding to the vibration of the molecule is observed for the latter calculation. This means that in MEP calculation, energy is not conserved, it does not take into account the involvement of kinetic energy after bond formation. The extra energy released after bond formation goes into rotational and vibrational energy of the products. Dynamics algorithm instead uses the dynamic information and shows that the excess energy is converted into vibrational such that the equilibrium bond length goes through oscillation.
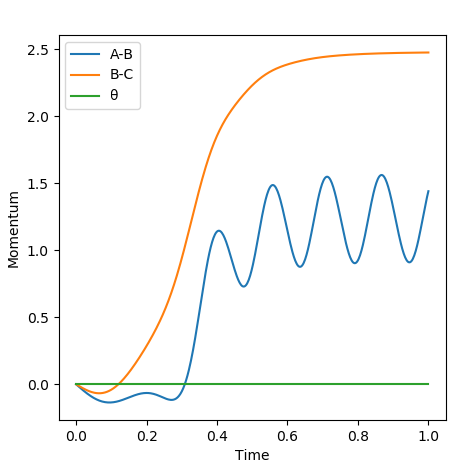
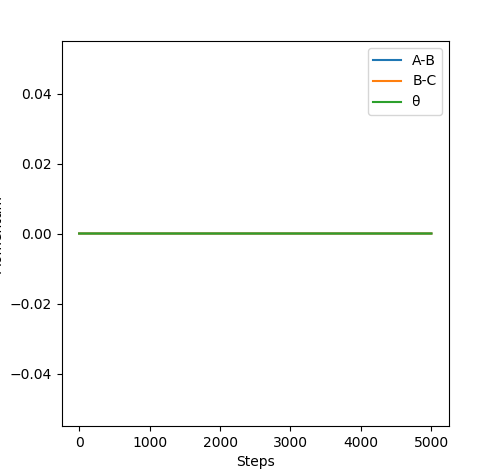
Even though the species are not given initial momenta, since they are positioned to start from a downhill position, conversion of potential energy to kinetic allows the movement of the species to the most stable position after crossing the transition state barrier, giving rise to changes in momentum as time progresses. Since MEP calculation ignores the conservation of energy, it assumes that the product will have no energy to vibrate and be stationary, resulting in no momentum.
Reactive and Unreactive Trajectories
| p1 | p2 | Etot | Reactive? | Internuclear Distance vs Time Graph | Illustration of the trajectory | Description of the dynamics |
|---|---|---|---|---|---|---|
| -1.25 | -2.5 | -99.018 | Yes | 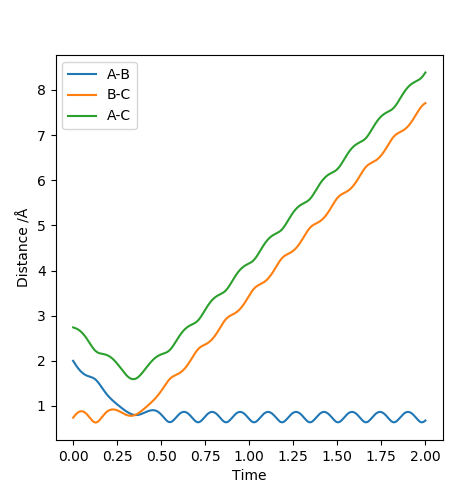 |
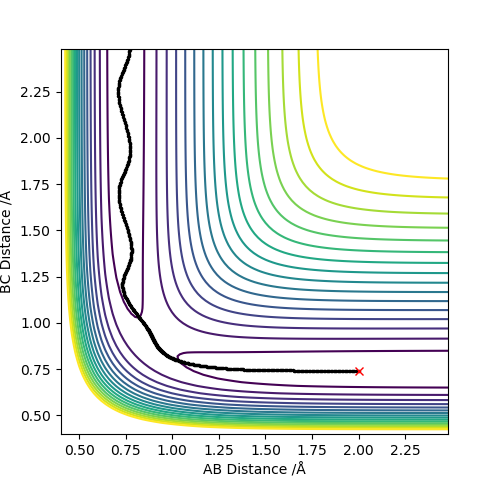 |
The collision between the HA atom and the HB-HC molecule results in a successful reaction. It could be seen that the product molecule has more vibrational energy than the reactant molecule. This is because the trajectory after crossing the transition state has a bigger frequency and amplitude of vibration. |
| -1.5 | -2.0 | -100.456 | No | 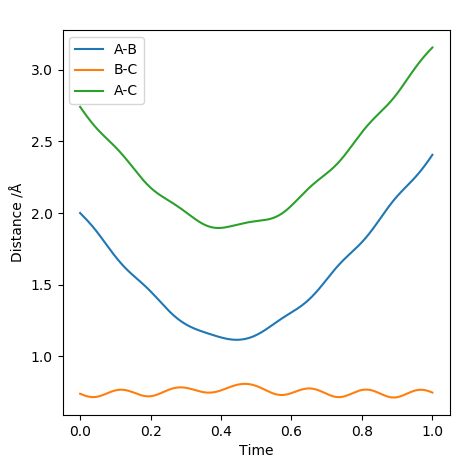 |
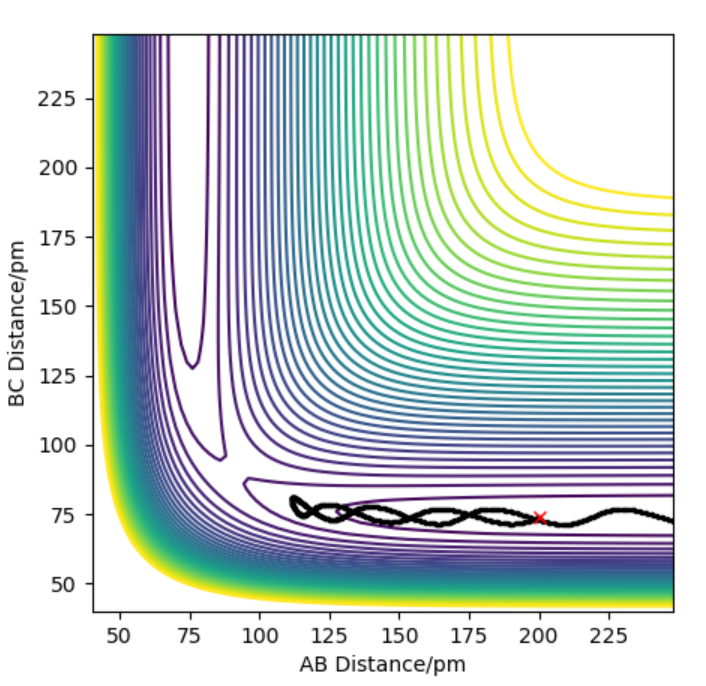 |
Although the molecule and the atom collide, the collision does not result in a successful reaction. The kinetic energy of the reactants is not enough to get over the activation energy barrier. Did they actually collide? Your distance plot didn't seem to indicate that.Sw2711 (talk) 14:52, 3 June 2019 (BST) |
| -1.5 | -2.5 | -98.956 | Yes | 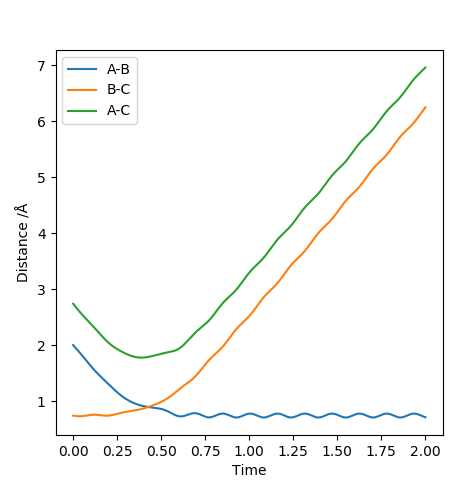 |
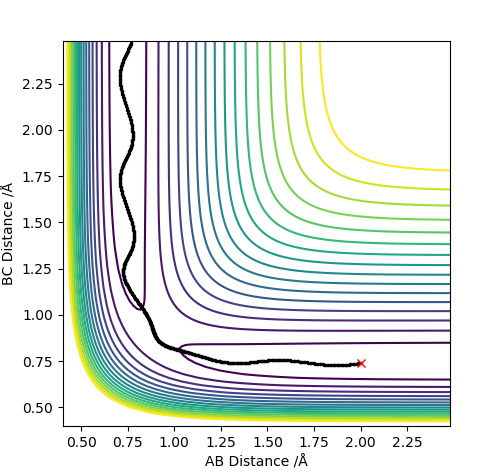 |
The trajectory in that case shows that products are produced. In comparison to the first trajectory the reactants have more vibrational energy because of having a slight increase towards negative in the momentum of the starting HB-HC molecule. This resulted in less defined vibrations in the final molecule when compared to the first trajectory. This could be explained such that although the kinetic energy was higher, the available kinetic energy, translational energy to cross the activation barrier was lower, causing less energy release to be converted to the vibrational energy of the HA-HB molecule. It's a very good habit to give a try to explain observations. But I am not sure if I understand your last sentence. The kinetic energy is high, but the translational energy is low? And did you mean that the translational energy converted to vibrational energy? If that was what you meant, I'm afraid I don't agree. There are some potential energy converted to vibrational energy too. Can you see that? Sw2711 (talk) 14:52, 3 June 2019 (BST) |
| -2.5 | -5.0 | -84.956 | No | 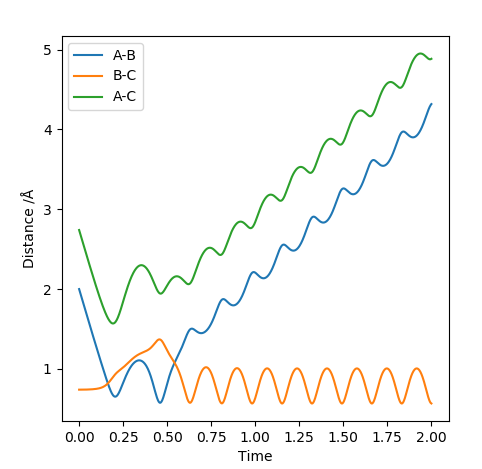 |
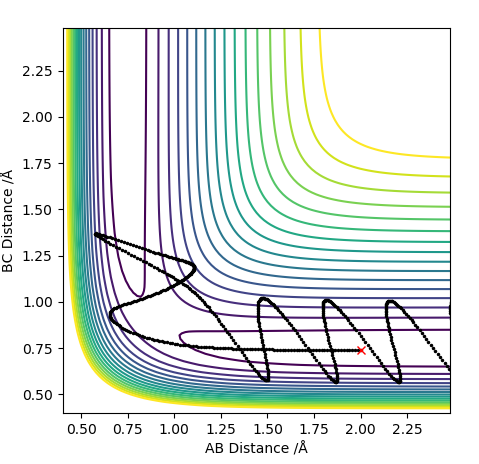 |
This reaction has enough energy that the reactants reach the transition state and the products are produced. The resulting product has so much energy that the bond length elongates back again which then breaks reforming the reactants. This case evokes the idea of an anharmonic oscillator. The product produced has a lot of vibrational energy that the vibration causes the bond length to reach to the levels that the attraction between the two nuclei is not enough to keep the atoms together. The released energy after breaking the bond is again enough to recross the transition state and produce the vibrationally excited HB-HC molecule. |
| -2.5 | -5.2 | -83.416 | Yes | 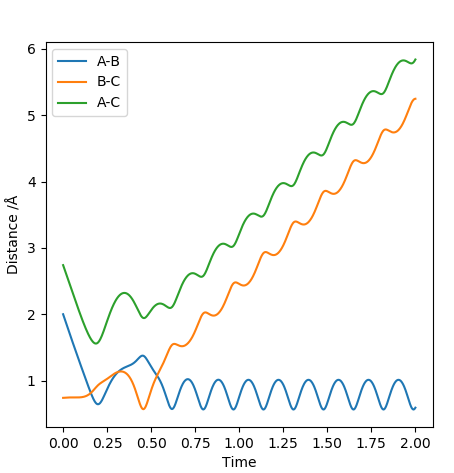 |
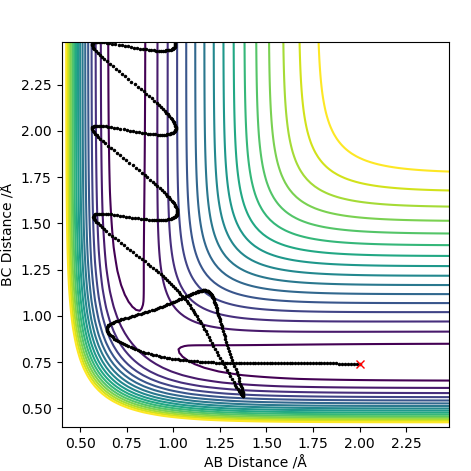 |
This trajectory results in a successful collision in comparison to the case above. The difference is such that more kinetic energy is put into the system. Increasing the pHAHB resulted in a collision that formed a bond which then quickly turned back to the reactants. The increased energy allowed for a second collision which then gave the vibrationally excited products successfully. It could be seen that the vibrations have high amplitude and frequency. |
Transition State Theory
State what are the main assumptions of Transition State Theory. Given the results you have obtained, how will Transition State Theory predictions for reaction rate values compare with experimental values?
The transition state theory employs the occurrence of that maximum state in between the reactants and products in order to equate the expression for thermal rate constant. The primary assumptions of the theory are listed below:
1-Born-Oppenheimer approximation(treating electronic and nuclear motion separately).
2-Distribution of reactants amongst states follows Maxwell-Boltzmann laws.
3-Once the transition state is crossed towards the products, molecules will not roll back to reform the reactants.
4-The motion available to the species in the transition state is translation only.
5-Irrespective of the reversibility of the reaction the states of the species in transition state are distributed in accordance with Maxwell-Boltzman distribution.[1]
In reaction 4 presented above, although the transition state was crossed over and the HA-B distance got smaller than they were at the transition state, the mechanism reverted, producing the reactants back again. The third assumption of the theory in that case fails. Theory instead suggests that, the greater kinetic energy should have resulted in a greater rate constant, resulting in the products even faster. In reality conservation of energy thus brings about a highly excited vibrational motion of the products. This relates to anharmonic oscillator which tells how bigger displacement of two atoms might result in the bond between the two atoms to be broken. The energy released by bond breakage also helps get back to the transition state and roll to the reactants side.
Good, just be aware that anything related to 'equilibrium, Boltzmann distribution' is not very applicable to our cases, because we only have three atoms in our system.Sw2711 (talk) 15:10, 3 June 2019 (BST)
Exercise 2: F + H2 and H + HF
Potential Energy Surfaces
By inspecting the potential energy surfaces, classify the F + H2 and H + HF reactions according to their energetics (endothermic or exothermic). How does this relate to the bond strength of the chemical species involved? Locate the approximate position of the transition state.
The PES graphs below show the two local minima, the former representing the level where reactants are found, H2 and F, and the latter which is much lower in energy standing for the products, H and HF.


It could be seen from the above diagram that the products have a more negative energy than the reactants.This means that the reaction will be exothermic, releasing energy when going from the reactants to products. The information shows that the HF molecule is more stable than the H2 molecule. This result could be attributed to the electronegativity differences between the atoms. While H is the most electropositive atom, F atom is the most electronegative. The bond between them would be very polar and ionic, resulting in very stable and strong bond with high dissociation energy. In contrast the H-H bond is non-polar and needs a lot less energy to dissociate. This is confirmed by the graph and the enthalpy calculation below.
This part is good. Sw2711 (talk) 15:12, 3 June 2019 (BST)
The following graph shows the relative energies of the reactants and products;
The following calculation confirms that the change in enthalpy is negative and so the reaction is exothermic.
deltaH=Hproducts-Hreactants

=-130.999-(104.009)= -26.99 kcal/mol
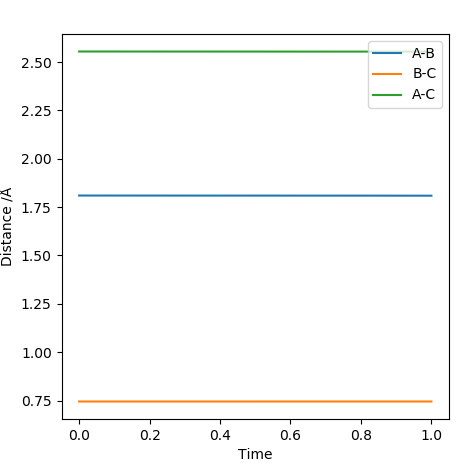
Transition State This part is good. Sw2711 (talk) 15:14, 3 June 2019 (BST) Figure 8 and 9 shows the relative positions of the reactants and products for the reaction. It could be seen that there is no obvious maximum occurring in the reaction path.
The method used for the fist reaction was employed again to locate the transition state. It was found that it occurred when HB-FA=1.81009 A and HB-HC=0.74489 A. The equilibrium length of a H-H bond in a H2 molecule is 0.74 A. This means that the minimal elongation of the equilibrium bond length resulted in the activated complex occurring very close to the reactants in energy in addition to its position such that it is disguised in the potential surface diagram.

Report the activation energy for both reactions.
For H<sub>2</sub>+F reaction:

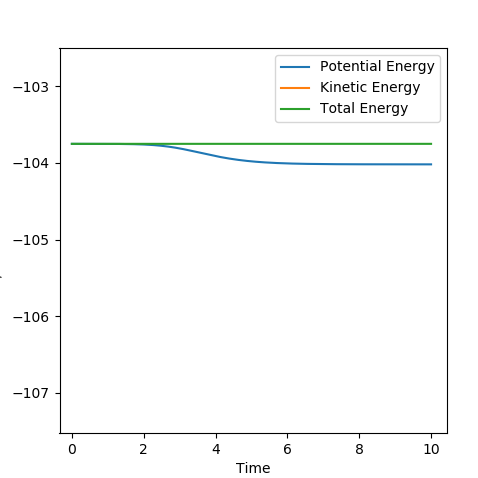
Transition State Energy-Reactants Energy= -103.754-(-104.009)= 0.26 kcal/mol

For HF+H reaction:
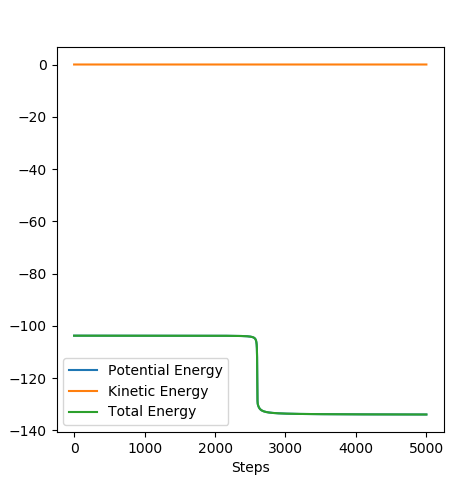
Transition State Energy-Reactant Energy= -103.754-(-133.999)= 30.25 kcal/mol
In order to calculate the energies of the reactants and products, one of the transition state positions was modified by +/-0.01 A. The calculation used 5000 steps to determine the local minima the species were going to fall.
This part is also very good.Sw2711 (talk) 15:14, 3 June 2019 (BST)
Reaction Dynamics
In light of the fact that energy is conserved, discuss the mechanism of release of the reaction energy. Explain how this could be confirmed experimentally.
This part is again very good. Sw2711 (talk) 15:15, 3 June 2019 (BST)
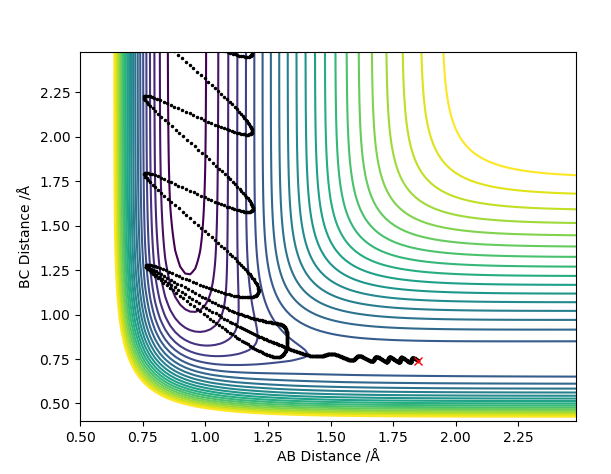
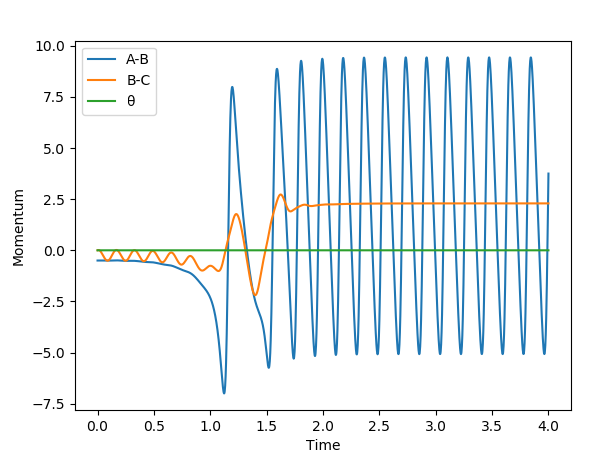
For the H2+F reaction, it was found that pHF= -0.5,pHF= 0, rHH= 0.74 A, pHF= 1.85 A were the conditions that would result in a successful reaction. The reaction gave a H-F molecule with high frequency and amplitude vibrations. This means that the energy released during the reaction was channelled into vibrational excitation of the product. The trajectory of the contour plot shows how close the reaction complex occurs to the reactants. It could be seen that as the distance between HC and HB increased and the H-F distance decreased, vibrational excition appeared in the trajectory. When the kinetic energy supplied to the reaction was just above the activation energy barrier the H2 molecule had most of its kinetic energy in the form of translation. The products were very excited vibrationally as could be seen from the momentum vs time graph. The HF molecule had high frequency and amplitude oscillation of the momentum.
The figure below shows the variations in the potential and kinetic energy showing that going through the reactants to products resulted in the vibrational excitation and so consevation of energy.
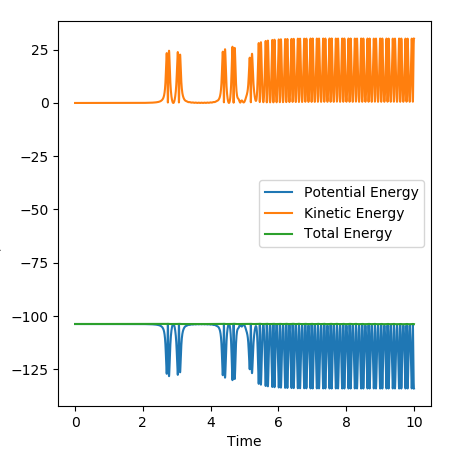
Infrared Chemiluminescence could be used to confirm that the produced HF molecule is vibrationally excited. Once the products are produced during a reaction, an electromagnetic radiation in the IR region is emitted which confirms that the products are vibrationally excited. The technique is primarily employed for the reactions that produce a Hydrogen-Halogen molecule in excited states.[1]
Discuss how the distribution of energy between different modes (translation and vibration) affect the efficiency of the reaction, and how this is influenced by the position of the transition state.
This part is also very good. Sw2711 (talk) 15:22, 3 June 2019 (BST) Polanyi's Rules and Hammond's Postulate:
Polanyi carried out many calculations in order to figure out how the energy is consumed and disposed in a bimolecular reaction. The position of a transition state could be described as "early" or "late". The early transition state occurs when the reactants are approaching to each other whereas the late transition takes place at the exit channels where the products separate. It was found that a bimolecular reaction with an early barrier would favour vibrationally excited products whereas a late barrier would result in the energy being channelled to translational mode rather than vibrational. For an early transition state, it is better for the reactants not to be excited vibrationally to have more energy available to reach the barrier. For a late transition state, being vibrationally excited will help the reactants surmount the activation energy barrier. [1]
Hammond's postulate also supports the findings of Polanyi. According to Hammond's postulate for an exothermic reaction, the transition state resembles the reactants and thus occurs at the entrance channel. In contrast an endothermic reaction has a late transition state resembling the products. [1]
As described above the reaction, H2+F, completely agrees with the rules such that, the reactants which enter the transition state at the entrance channel result in vibrationally excited products.
When it comes to the reverse reaction, HF+H, it is the H-F molecule and a H atom that we start with. The reaction is endothermic, and the vibrationally excited molecule channels its energy into the translational energy of the product, since the H-H bond forms just after the transition state.
The trajectory below shows how the success of the reaction is affected, if the H2 molecule were to have greater kinetic energy and to be vibrationally excited in the reaction H2+F:
Conditions: pHF= -0.5,pHF= -2, rHH= 0.74, pHF= 1.85
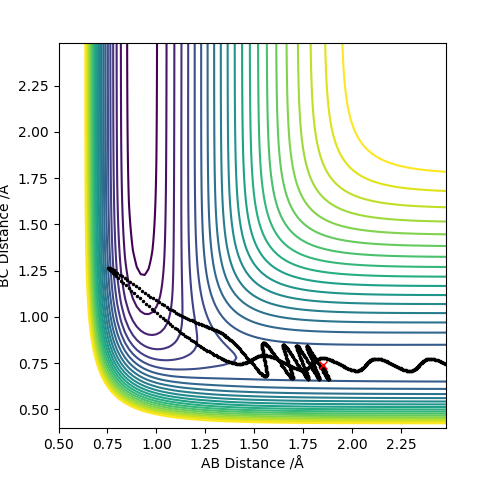
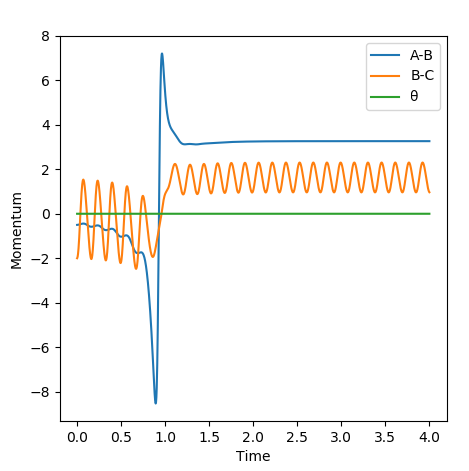
In this case, it could be seen that, starting the reaction with a vibrationally excited H2 molecule does not result in a successful collision. Reaching the early transition state with high vibrational energy prevents the formation of the products.
In conclusion the efficiency of a reaction depends very much on the kinetic energy provided to the starting molecules and the position of the transition state. The example above showed that for an early transition state, increasing the kinetic energy of the reactants decreased the efficiency of the reaction.
The reactive trajectory for H+HF was found to take place when pHF=-3, pHH= -1, rHF= 0.74 A, rHH= 1.85 A. For the reaction to be successful, the reactant, H-F bond needed to be highly excited vibrationally to be able to produce the products, with most of the reactant energy being channelled to the translational mode of the product. The endothermic reaction again confirms that the late transition energy was reached with the high vibrational excitation of the reactant. Since for a late transition state the product forms just after the bond between them are formed, all of the energy goes into their translation. If it were to vibrate at that point, the bond would break and the transition state would be recrossed to reform the reactants.
