01354530estela
Molecular Reaction Dynamics
Exercise 1: H + H2 system
Dynamics from the transition state region
On a potential energy surface diagram, how is the transition state mathematically defined? How can the transition state be identified, and how can it be distinguished from a local minimum of the potential energy surface?
On a potential energy surface diagram the transition state is mathematically defined as a saddle point, this is not the same as a local maxima or minima. It is the maximum on the minimum energy path relating the reactants to products and therefore is the point on the graph where the slopes in orthogonal directions have partial double derivatives of opposite sign.
In other words, ∂V(ri)/∂ri=0 for all three (maxima, minima and saddle point), i.e. the gradient of the potential energy surface = 0 at all three points.
However, if you take the partial derivatives in opposite directions to the point, you can differentiate between the three as a local minima, for instance, will always have a positive second derivative independent from the plane you measure it relative to. By contrast, a saddle point will have a different second derivative depending on which plane you measure it relative to i.e. the partial derivative in one direction will be a maxima (negative) and in the orthogonal direction will be a minimum (positive).
Ng611 (talk) 15:55, 7 June 2019 (BST) Not opposite directions, but orthoganal directions. Good answer otherwise.

Where A, B and C are the three H atoms respectively; The intersection between the arrows (yellow cross) represents the transitions state.
Report your best estimate of the transition state position (rts) and explain your reasoning illustrating it with a “Internuclear Distances vs Time” plot for a relevant trajectory.
At the transitioin state r1 = r2(and p1=p2=0) and there is no gradient at the directions perpendicular to the ridge. This can be used to find the position of the transition state using an internuclear vs time plot and looking for the distance (AB=BC; r1=r2) at which there are no oscillations nor direction towards the reactants or products. This distance was found to = 0.9078 A
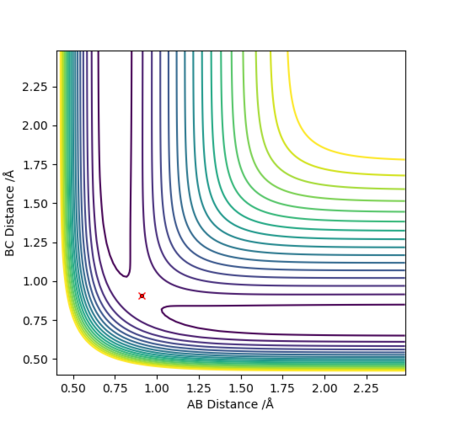
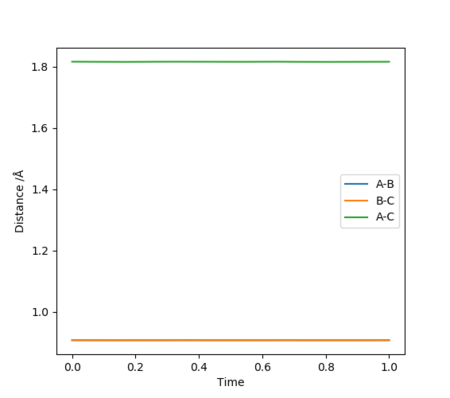
Note there is no overall release or absorption of energy as the reaction forms the same bond that is being broken and therefore the TS is exactly is the middle where AB=BC (follows hammond's postulate-> neither exo nor endo and so TS equally resembles the reactants as the products) and the reactants have the same energy as the products (shown by surface plot)
Comment on how the mep and the trajectory you just calculated differ.
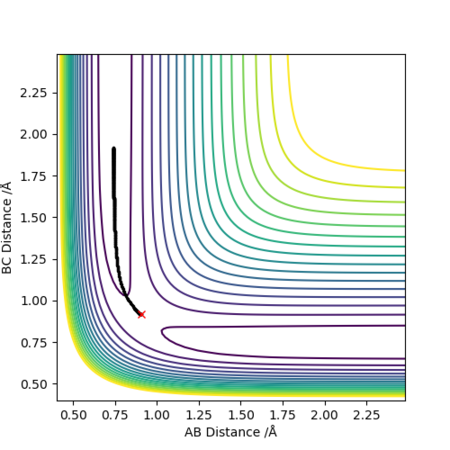
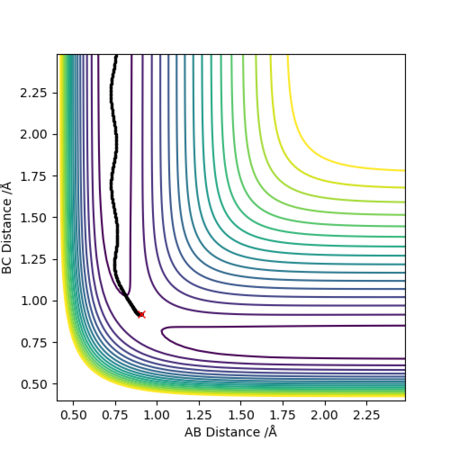
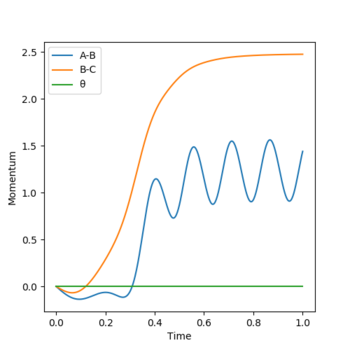
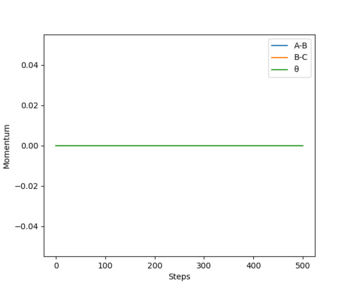
From the contour plots of r1(BC)= 0.9179 and r2(AB)=0.9079 respectively, you can see how the trajectory greatly differs depending on whether you set the calculation type to dynamics or mep. A Mep plot doesn't provide a realistic account of the motion of the atoms during the reaction as it takes the vibrational energy to = 0. As a result, you can see a straight line representing the trajectory on the graph on the top. By contrast, the dynamic plot shows how the trajectory of the reaction oscillates as it takes into account the vibrational energies the atoms possess. The momenta vs time plots illustrate this concept more clearly by demonstrating how the momentum of the system is constant regardless of the values you input for p1 and p2 in the mep representation (bottom graph). However, the momentum is seen to change with time in a dynamic plot as although it takes the translation energy to = 0 (i.e. p1=p2=0), it accounts for the vibrational quantised energies of the molecules which accounts for the variation in momentum (top graph).
Reactive and unreactive trajectories
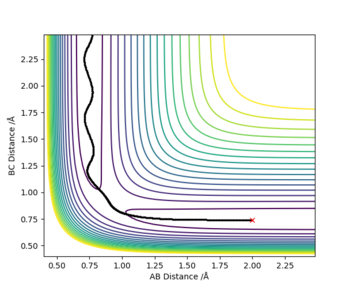
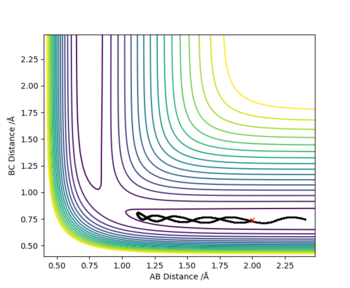
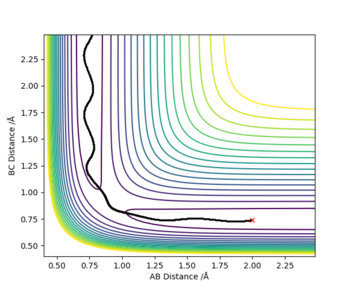
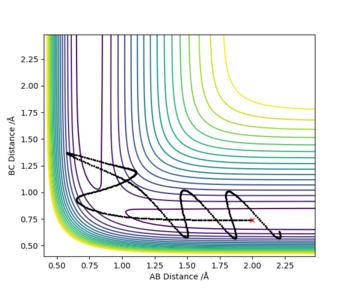
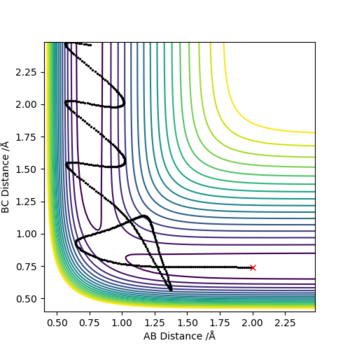
Complete the table above by adding the total energy, whether the trajectory is reactive or unreactive, and provide a plot of the trajectory and a small description for what happens along the trajectory. What can you conclude from the table?
HA + HB-HC → HA-HB + HC
The initial distances where unchanged throughout with r1 (BC)= 0.74 Å and r2 (AB) = 2.0 Å; the red cross on the plots represents the start of the trajectory.
State what are the main assumptions of Transition State Theory. Given the results you have obtained, how will Transition State Theory predictions for reaction rate values compare with experimental values?
The main assumptions of the transition state theory are the following:
1) The reactants and the transition state are in equilibrium.
2) The energy of the reactant particles is described by the Boltzmann distribution.
3) If reactants reach the transition state, the latter does not collapse back to the reactants and the reaction progresses into the products
In this case, the most relevant assumption is the third one, which implies that once the transition state is reached the reaction always progresses into the products but we know this is not true from the experimental data shown in the table above. Reaction 4 above represents a barrier recrossing, which as previously described shows how the system crosses the transition state and the HA-HB bond forms, however, this collapses back into the products reforming the HB-HC bond. The TST would predict this trajectory to be reactive but experimental values show otherwise.
Ng611 (talk) 16:01, 7 June 2019 (BST) Good answer. What about Quantum Mechanical effects?
EXERCISE 2: F-H-H system
PES inspection
By inspecting the potential energy surfaces, classify the (1) F + H2 and (2) H + HF reactions according to their energetics (endothermic or exothermic). How does this relate to the bond strength of the chemical species involved?
(1) F+ H2 → F-H + H
H-H (r1) bond distance= 0.74 Å; H-F (r2) bond distance= 2.3 Å; p1=0 kg ms-1; p2=-2.7 kg ms-1
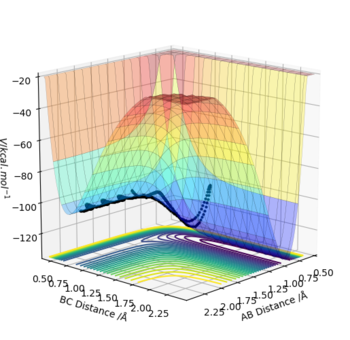
Where atom A=F, B=H and C=H respectively.
The reactants (BC) are higher in energy than the products (AB) and therefore it's exothermic.
(2) H + H-F → H-H + F
H-F (r1) bond distance= 0.91 Å; H-H (r2) bond distance= 2.3 Å; p1=0 kg ms-1; p2=-2.7 kg ms-1
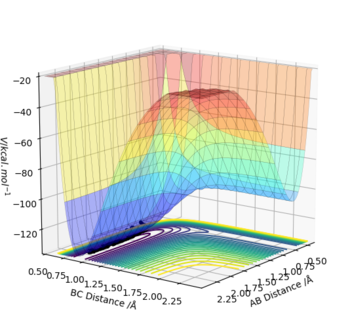
Where atom A=H, B=H and C=F respectively.
From the plot you can see the reactants (BC) are lower in energy than the products (AB) and therefore we can say the reaction is endothermic.
Breaking bonds requires energy while making bonds releases energy. This suggests that the H-F bond is stronger than the H-H bond as the reaction that results in its formation is exothermic, meaning the activation energy for breaking the H-H bond is small compared to the release of energy as a result of the H-F bond formation. By contrast, the amount of energy you need to put into the system to break the H-F bond is greater than that released by the formation of the H-H bond, and so the second reaction is endothermic.
Locate the approximate position of the transition state.
Hammond's postulate states how the transition state (TS) of a given reaction will resemble either the reactants or the products depending which one is closer in energy. i.e. For an endothermic reaction, the products are closer in energy, and therefore in structure to the transition state.
(1) Exothermic Reaction: The TS will resemble the reactants in structure as they are closer in energy than the products, and therefore the TS will be located at a position where the distance between the reactants i.e. H-H (BC), is smaller than that of the products i.e. H-F (AB). In other words, BC<AB depicted by the bottom graph showing the inter-nuclear distance vs time.
So at the TS:
H-H (BC) bond distance= 0.745 Å and
H-F (AB) bond distance= 1.812 Å
(p1=p2=0)
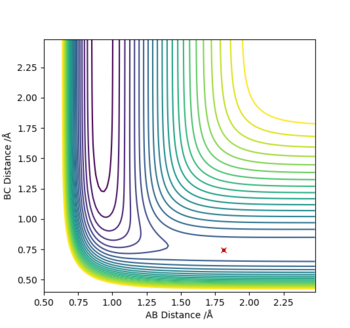
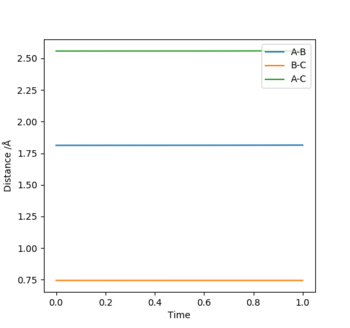
Where atom A=F, B=H and C=H respectively.
(2) Endothermic Reaction: The TS will resemble the products in structure as they are closer in energy to it than the reactants, and therefore it will be located at a position where the distance between the reactants i.e. H-F (BC), is larger than that between the products i.e. H-H (AB). i.e. BC>AB (shown by Distance vs Time graph).
So at the TS:
H-F (BC) bond distance= 1.812 Å
H-H (AB) bond distance= 0.745 Å
(p1=p2=0)
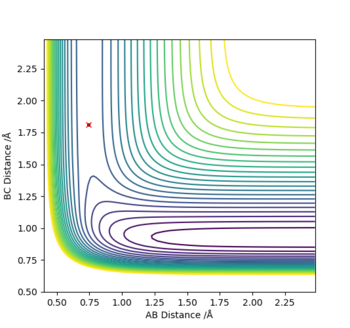
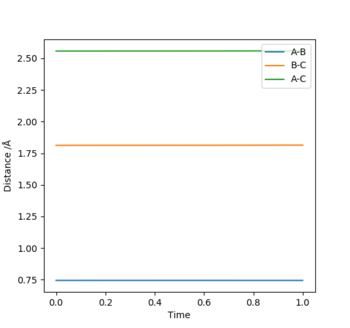
Where atom A=H, B=H and C=F respectively.
Report the activation energy for both reactions.
The activation energy is formally defined as the energy difference between the transition state and the energy of the reactants.
(1) Exothermic Reaction:
Energy of the TS = -103.752 kcal. mol-1
Energy of the Reactants = -103.901 kcal. mol-1
So the activation energy= -103.752--103.901 = 0.149 kcal. mol-1
The energy of the reactants was calculated using a MEP type calculation by adding 0.1 Å to the H-F (AB) bond length while the rest of the conditions were kept constant yielding the following conditions:
H-H (BC) bond distance= 0.745 Å and
H-F (AB) bond distance= 1.912 Å
(p1=p2=0)
As a result, the reaction trajectory was pushed towards the reactants (BC) and the MEP calculations yielded the following graphs:
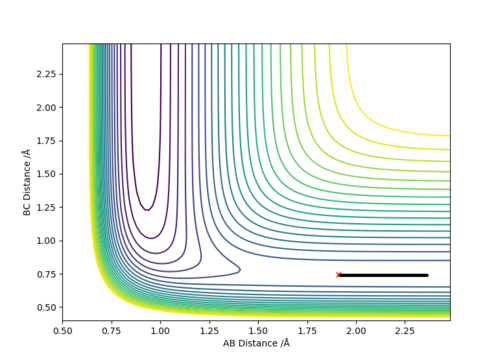
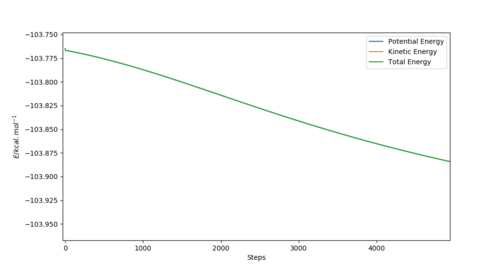
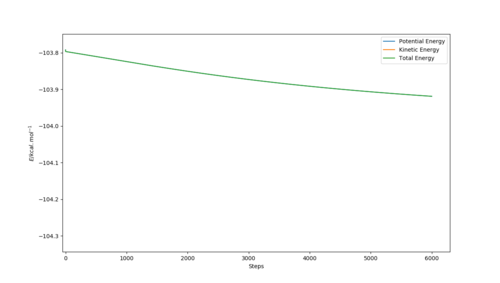
Where atom A=F, B=H and C=H respectively.
The bottom graphs shows the step in energy (Ea) between the the transition state energy and the reactant's energy (BC) and demonstrates how the activation energy for the F + H-H reaction is approximately 0.149 kcal. mol-1.
(2) Endothermic Reaction:
Energy of the TS = -103.752 kcal. mol-1
Energy of the Products = -133.965 kcal. mol-1
So the activation energy= -103.752--133.965 = 30.213 kcal. mol-1
The energy of the products was calculated using a MEP type calculation by subtracting 0.1 Å to the H-F (AB) bond length while the rest of the conditions were kept constant yielding the following conditions:
H-H (BC) bond distance= 0.745 Å and
H-F (AB) bond distance= 1.712 Å
(p1=p2=0)
As a result, the reaction trajectory was pushed towards the products (AB) and the MEP calculations yielded the following graphs:
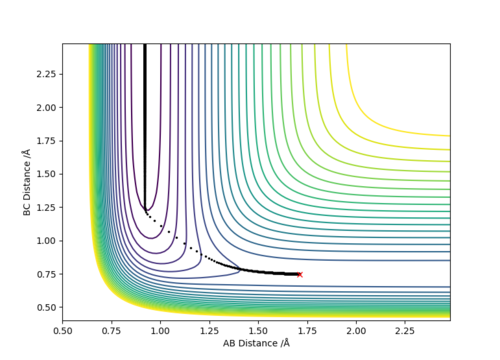
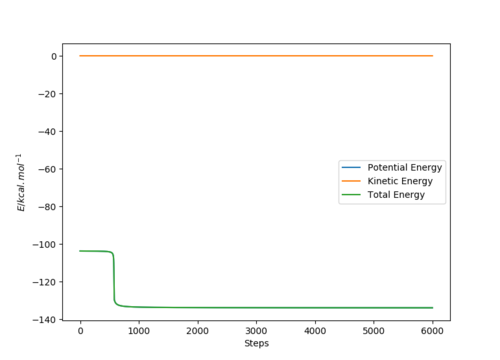
Where atom A=F, B=H and C=H respectively.
The bottom graph shows the step in energy (Ea) between the the transition state energy and the product's energy (AB) and demonstrates how the activation energy for the H + H-F reaction is approximately 30.213 kcal. mol-1
16:02, 7 June 2019 (BST) Good Calculations!
Reaction dynamics
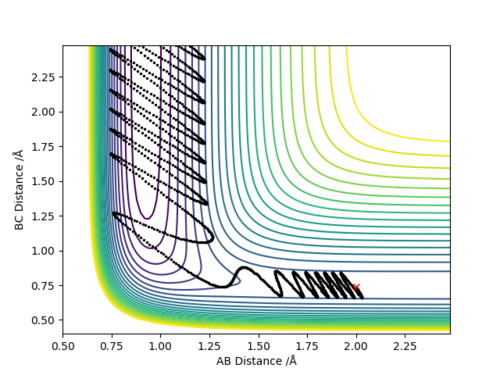
The initial set of conditions that yield a reactive trajectory for the F + H-H → H-F + H are the following:
H-H (BC) bond distance= 0.74 Å
H-F (AB) bond distance= 2 Å
pH-H= -2.001 kg. ms-1
pH-F= -0.501 kg. ms-1
The following graph demonstrates the reactive trajectory:
In light of the fact that energy is conserved, discuss the mechanism of release of the reaction energy. Explain how this could be confirmed experimentally.
A plot of Energy vs Time under the reaction conditions described above demonstrates how the total energy of the system is conserved as it remains constant, depicted by a straight green line in the following graph:
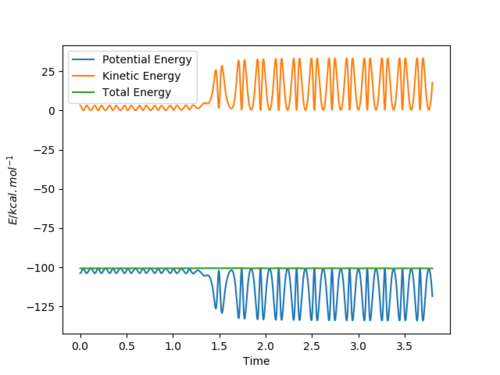
Any decrease in potential energy is compensated by a corresponding increase in the kinetic energy and vice versa, resulting in an overall constant total energy. In other words, there is no net loss or gain of energy, but instead energy is being converted from one form into another which basically describes the law of conservation of energy. In this example, as the reactant molecules for instance gain kinetic energy, which results in them moving faster, they lose the equivalent amount of potential energy. This could be confirmed experimentally through calorimetry measurements.
Ng611 (talk) 16:03, 7 June 2019 (BST) NO! Calorimetry does not distinguish between translation and vibrational KE. Think of a method that does.
Ng611 (talk) 16:07, 7 June 2019 (BST) Where is your discussion of Polanyi's rules?

