013366322
EXERCISE 1: H + H2 system
Q1 - On a potential energy surface diagram, how is the transition state mathematically defined? How can the transition state be identified, and how can it be distinguished from a local minimum of the potential energy surface?
On the potential energy surface, the transition state is the position along the minimum energy pathway, linking reactants and products, where potential is highest. The transition structure exists at a saddle point of the potential energy surface - that is when ∂V(ri)/∂(ri)=0. Furthermore, the 2nd partial derivatives with respect to the orthogonal vectors r1 and r2 have opposite signs; one is positive and the other negative. This tells us that this is a saddle point.
Be careful to makesure you say "potential energy" not just "potential". And yes this is all correct and clearly explained but you are missing part of the definition. The TS is a saddle point because it is the maximum along the reaction trajectory and a minimum in the orthogonal direction, so which vector r1 or r2 will be positive or negative? Rk2918 (talk) 12:47, 3 June 2019 (BST)
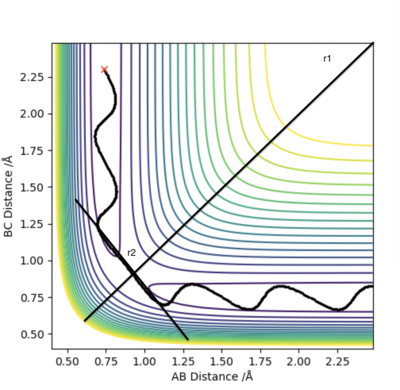
Q2 - Report your best estimate of the transition state position (rts) and explain your reasoning illustrating it with a “Internuclear Distances vs Time” plot for a relevant trajectory.
 |
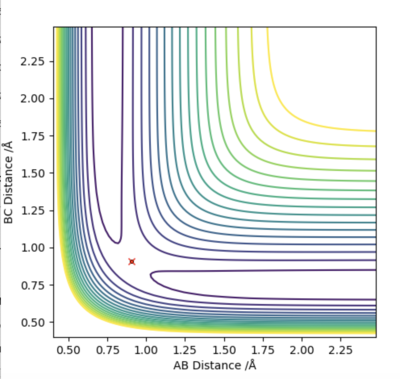 |
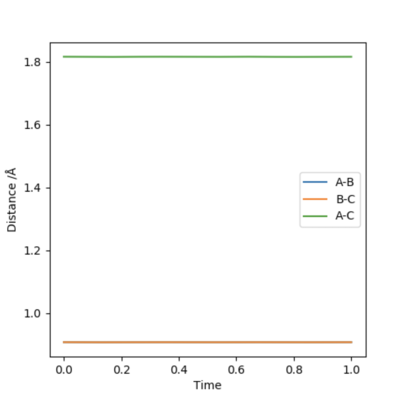
Firstly, we set AB=BC and momentum equal to 0. Then, plotting a graph of Internuclear Distance vs Time, we can find the transition state. The optimised distance is the distance at which there is no trajectory towards either reactants or products and at which oscillations are reduced producing a straight line as seen in the plot above. As the graph shows straight lines, we know there is no vibration, and the atoms stop moving. That is, potential energy is maximum and kinetic energy zero. As such, the optimised distance is found to be 0.9079 Å. Looking at the contour plot above, the transition state can also be seen in approximately the correct location, backing up the result.
Great explanation - very clear and well understood.Rk2918 (talk) 12:50, 3 June 2019 (BST)
Q3 - Comment on how the MEP and the trajectory you just calculated differ.
 |
 |
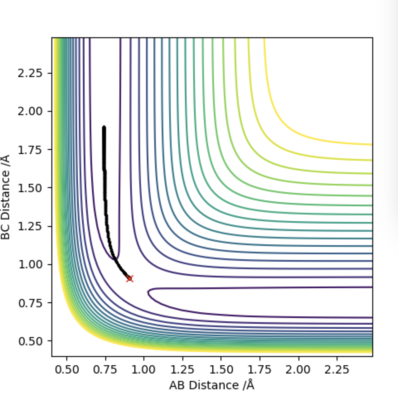
The MEP graph shows no molecular vibration (as velocity=0) with momentum being equal to 0 in every time step. In comparison, the dynamics plot shows the vibrational energy of the molecule as seen by the non-straight line.
True, can you think of why? In terms of the calculation process itself? Rk2918 (talk) 12:54, 3 June 2019 (BST)
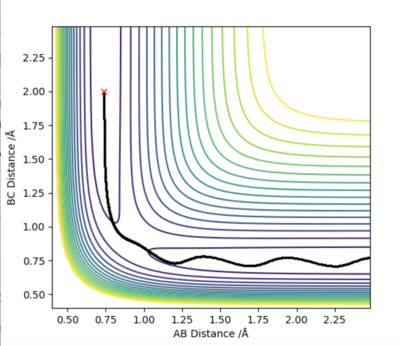
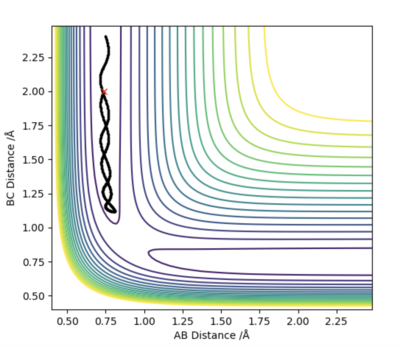
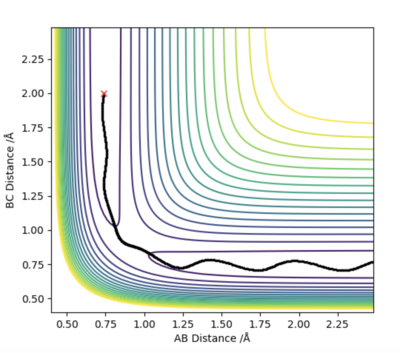
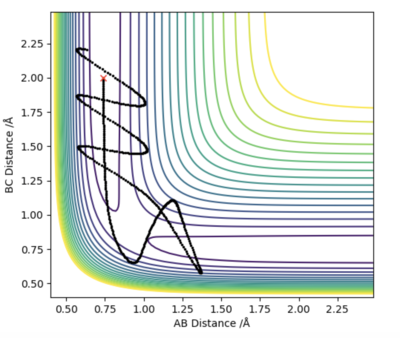
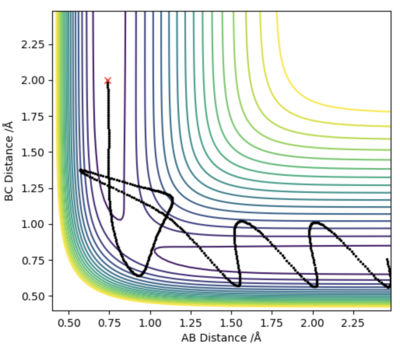
Q4 - Complete the table above by adding the total energy, whether the trajectory is reactive or unreactive, and provide a plot of the trajectory and a small description for what happens along the trajectory. What can you conclude from the table?
It can be concluded that if reactants do not have sufficient kinetic energy to surpass the activation barrier, then the reaction will not occur. Furthermore, if the reactants have an excess of kinetic energy, the reaction also may not proceed as the products formed turn back into reactants.
Yes, or you could also say that there is not a simple threshold energy to determine whether or not the system will be reactive. It is not as simple as molecules that do have the activation energy will react, and molecules that don't won't react. That would be the simplest form of conclusion to be drawn from this. Your observations are clear and insightful. Rk2918 (talk) 12:59, 3 June 2019 (BST)
Q5 - State what are the main assumptions of Transition State Theory. Given the results you have obtained, how will Transition State Theory predictions for reaction rate values compare with experimental values?
Electron and nuclear motion are independent Energy of the particles follows the Boltzmann distribution Once reactants begin to combine and form the transition state, the transition state structure does not collapse to form reactants again
Theory states that transition state structure does not collapse to reform the reactants. However, as experimental procedure shows, this can occur. As theory assumes that all reactions with sufficient energy will go onto form products, the real rate of reaction is much slower than in theory as reactants can be reformed.
Great!Rk2918 (talk) 13:00, 3 June 2019 (BST)
EXERCISE 2: F - H - H system
Q6 - By inspecting the potential energy surfaces, classify the F + H2 and H + HF reactions according to their energetics (endothermic or exothermic). How does this relate to the bond strength of the chemical species involved?
 |
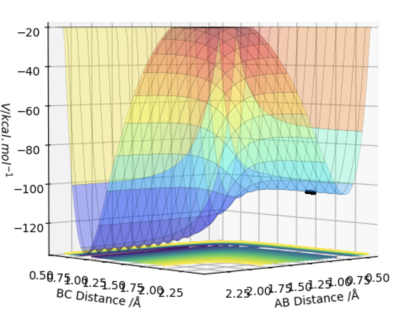 |
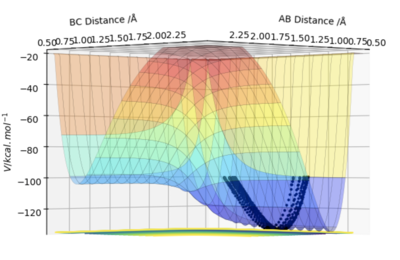
As seen above, the surface plot for F + H2 starts at a high energy position dropping down lower energy after the transition state. Therefore, this is an exothermic reaction. In contrast, for the surface plot of HF + H, the reaction starts at a low energy position and needs a large amount of energy to over come the activation energy barrier. After passing the transition state, the energy falls a small amount. This reaction is therefore endothermic. From this, we can conclude that the HF bond is stronger than the HH bond since HF is lower in energy than HH.
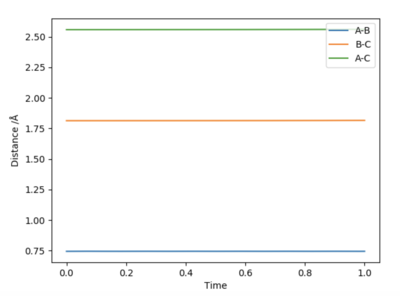
Furthermore, Hammond's Postulate states that the transition state will resemble either the product or reactants, whichever it is closer to in energy. To find the transition state, optimisation was completed as before with both momenta set to zero. Optimisation was completed so that there was minimal oscillation (gradient of line =0) seen for the Internuclear Distance vs Time graph, as shown below. The optimised distances were found to be rts(H-F)=1.813 Å and rts(H-H)=0.7445 Å.
Q7 - Report the activation energy for both reactions.
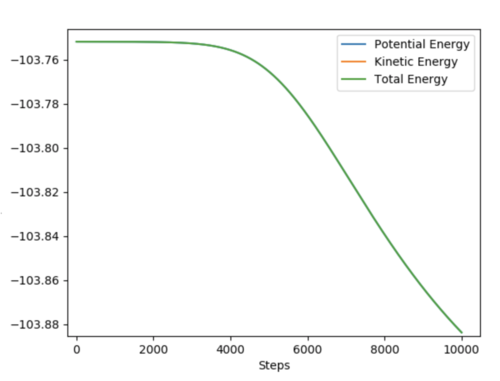
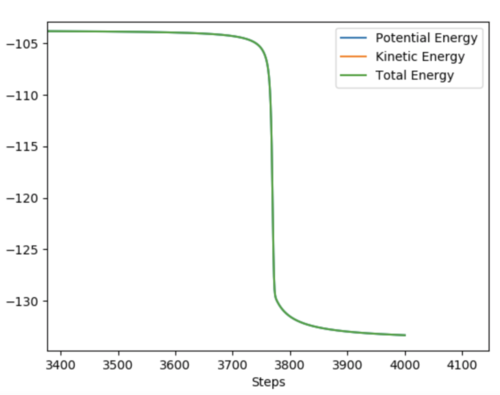
Below shows two graphs depicting the total energy plot of both reactions. The activation energy for both reactions can be calculated as the difference between the highest and lowest energy levels.
 |
 |
|---|
Activation Energy(H + HF)= +31.22 kcalmol-1 Activation Energy(F + H2)= +0.130 kcal mol-1
All correct and clearly presented with appropriate diagrams. Rk2918 (talk) 13:01, 3 June 2019 (BST)
Q8 - In light of the fact that energy is conserved, discuss the mechanism of release of the reaction energy. Explain how this could be confirmed experimentally.
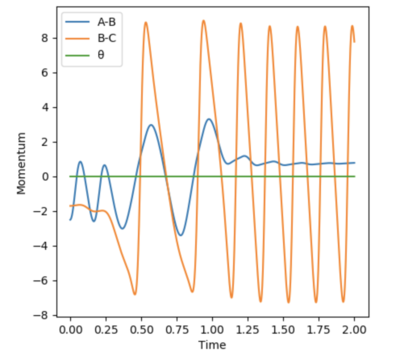
For the reaction of F + H2 a reactive trajectory was found using the following set of initial conditions: AB = 0.74 Å, BC = 1.80 Å, pAB = -2.5, and pBC = -1.70. Using these intial conditions the graph of Momentum vs Time was produced, as seen below.
 |
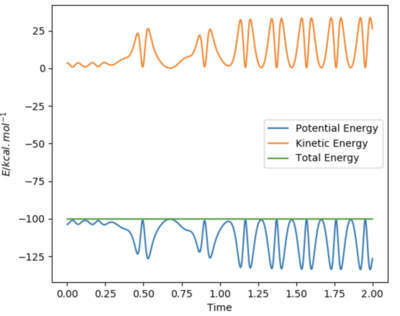 |
As you can see, whenever potential energy is lost, kinetic energy is gained by the same amount. Due to the exothermic nature of this reactrion, this kinetic energy is then converted into heat and can experimentally be seen by the increase in temperature.
Yes, that's right, can you think of a particular experimental setup/technique which can detect such a change in conditions accurately?Rk2918 (talk) 13:02, 3 June 2019 (BST)
Q9 - Discuss how the distribution of energy between different modes (translation and vibration) affect the efficiency of the reaction, and how this is influenced by the position of the transition state.
Polanyi's Rule states that vibrational energy is much less successful in promoting an early transition state than translational energy is. Additionally, the opposite is true - translational energy is more efficient in promoting a late transition state than vibrational energy.
As seen above when calculating the activation energy of reaction, the reaction of F + H2 is exothermic. Hammond's Postulate states that this reaction therefore has an early transition state. Using Polanyi's Rules, this reaction would be most effectively activated by translational energy. Similarly, for the reaction of H + HF (endothermic), this would be most efficiently activated by vibrational energy.
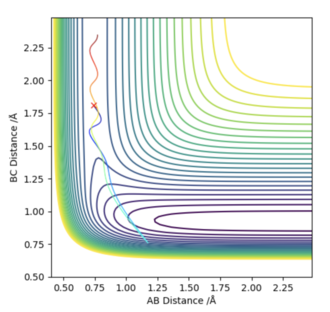
For the first reaction of F + H2, I used the values of rHH=0.74 Å, and rHF=1.81 Å. Then i looked at the contour plots for when pAB=-2.5 and pBC=-0.5 (Left diagram), and for when pAB=-0.5 and pBC=-2.5 (right diagram). For the initial set of conditions, there is greater vibrational energy, and the 2nd set of conditions, greater translational energy.
According to Polanyi's Rules, we would expect this reaction to be best activated by vibrational energy. The two graphs below agree with these findings.
 |
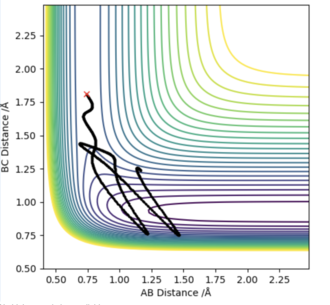 |
I don't know whether I am just not managing to clearly decipher your figure, but the left diagram doesn't look reactive to me and the right one does. You haven't done any calculations wrong but you've mixed up your order of Polanyi's rules. In an early barrier reaction, kinetic energy is effective in overcoming the barrier but vibrational energy is ineffective in overcoming the barrier. The distinction between the two systems would be clearer if you had one with high vibrational energy and low kinetic and vice versa. These both look like they have quite high vibrational energy. Also, TST and Polanyi's rules should both be quoted with an accompanying literature reference. Rk2918 (talk) 13:10, 3 June 2019 (BST)

