01333824
Molecular reaction dynamics
H+H2 System
Initial conditions:
Distance: AB=0.73 BC=2.30
Momentum: AB=0 BC=-2.7
Question 1: On a potential energy surface diagram, how is the transition state mathematically defined? How can the transition state be identified, and how can it be distinguished from a local minimum of the potential energy surface?
-Transition state is defined as the saddle point on the potential surface diagram. For a function involves r1 and r2, saddle point is defined as:
The partial derivative of r1 and r2 equal to 0.
And fr1r1fr2r2-f2r1r2<0
As the hydrogen atom C approaches hydrogen molecule AB, their distance decreases while the bond length remains almost constant although it vibrates. At certain point when the distance between the atom and molecule equals to the bond length of hydrogen molecule, which is r1=r2, the transition state is therefore defined.
Local minimum point is defined as
The partial derivative of r1 and r2 also equal to 0.
But fr1r1fr2r2-f2r1r2>0 and fr1r1>0
The saddle point can therefore be distinguished from local minimum.
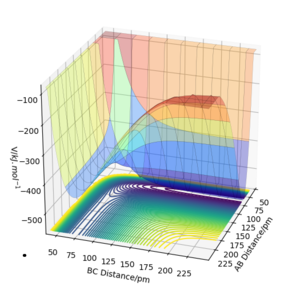
Question 2: Report your best estimate of the transition state position (rts) and explain your reasoning illustrating it with a “Internuclear Distances vs Time” plot for a relevant trajectory.
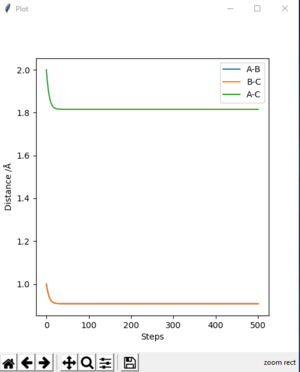
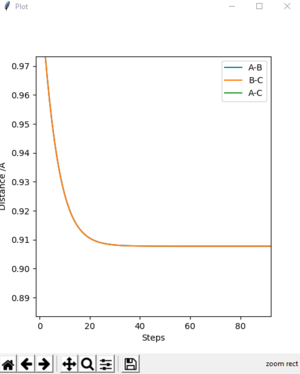
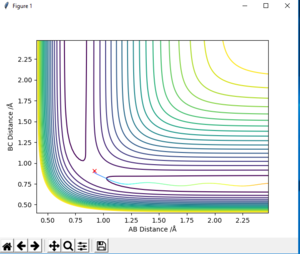
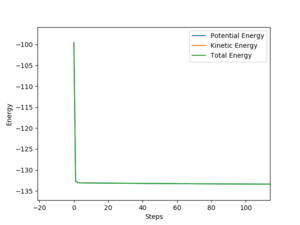
-The transition state is found to be 0.908 Å. At transition state, r1 = r2 and both of their momentum are set to 0. MEP calculation type is used to get Fig.2. Data are exported into excel. The estimate transition state is determined when the potential energy is minimum, which is the saddle point of the curve. The transition state can be seen on the bigger version of internuclear distance vs time graph on Fig.3
Question 3: Comment on how the mep and the trajectory you just calculated differ.
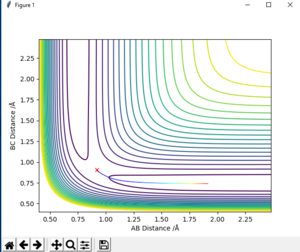
- The velocities are set to be 0 in MEP, therefore the kinetic energy in MEP=0, which can be seen on fig.4 and the total energy is not conserved. However, in dynamic calculation, both kinetic and potential energy exist and the total energy is conserved. (Fig.5)
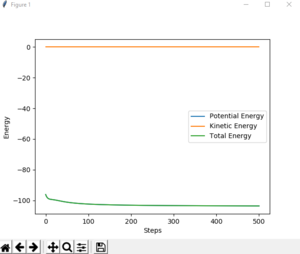
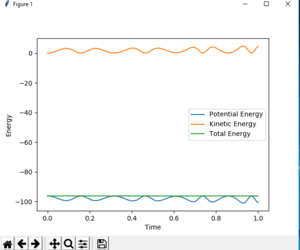
Also, in dynamic calculation, there is vibration for molecules as they approach. But in MEP calculation, no vibration is observed.
Question 4
| p1 | p2 | Etot | Reactive? | Description of the dynamics |
|---|---|---|---|---|
| -1.25 | -2.5 | -99.018 | reactive | on fig. 8 |
| -1.5 | -2.0 | -100.456 | unreactive | on fig. 9 |
| -1.5 | -2.5 | -98.956 | reactive | on fig. 10 |
| -2.5 | -5.0 | -84.956 | unreactive | on fig. 11 |
| -2.5 | -5.2 | -83.416 | reactive | on fig. 12 |
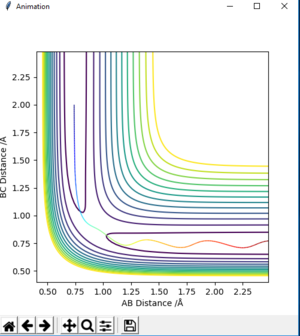
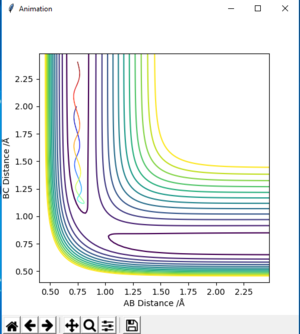
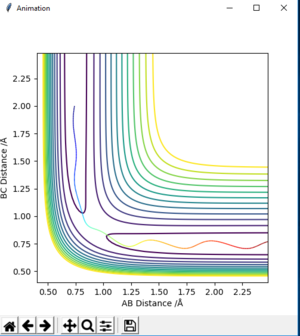
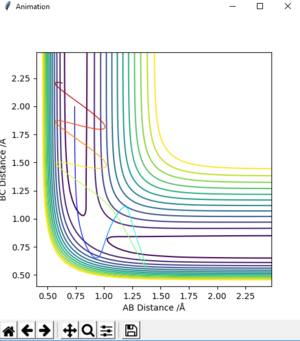
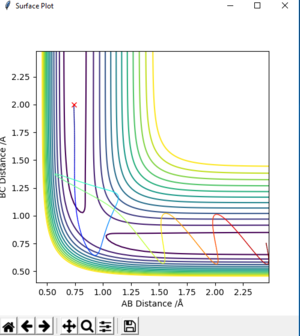
The descriptions are a little vague because you don't mention vibrations. Pu12 (talk) 23:00, 16 May 2019 (BST)
Conclusion: In most conditions, the key factor of the reaction happens or not depends on whether it has sufficient kinetic energy to overcome the barrier of activation energy.
However, in some particular circumstances, too large of kinetic energy could also result in failure of the reaction.
Q5 State what are the main assumptions of Transition State Theory. Given the results you have obtained, how will Transition State Theory predictions for reaction rate values compare with experimental values?
Assumptions: 1. nuclei and electrons in a molecule can be separated.
2. Molecules of reactant are distributed along the Maxwell-Boltzmann distribution.
3. If the transition state is crossed, it cannot turn back and reform the reactant.
4. In transition state, motion along the reaction coordinate can be separated from other motions and treated as translation.
5. The transition state are distributed among their states along Maxwell-Boltzmann distribution even if the equilibrium is not reached.
References: Jeffery I. Steinfeld Joseph S. Francisco, William L.Hase, Statistical approach to reaction dynamics transition state theory, Chemical kinetics and dynamics, 2nd edition, Vol10.2 ,1998, P290.
In theoretical predictions, as long as transition state is reached, the initial reactant cannot reform. However, in experiment 4, after the transition state is reached, the initial reactant reforms.
You should mention that the effect this will have is that transition state theory predictions will overestimate the success of reactions. Pu12 (talk) 23:00, 16 May 2019 (BST)
F-H-H System
Q6 By inspecting the potential energy surfaces, classify the F + H2 and H + HF reactions according to their energetics (endothermic or exothermic). How does this relate to the bond strength of the chemical species involved?
Atom A is defined as fluorine, B and C are defined as hydrogen atoms.
-For reaction F + H2 to HF + H, which is from BC to AB and it can be seen from fig. 13 which is from left to right, the reaction pathway decreases. Therefore, this reaction is exothermic.
For reaction H + HF to H2 + F, which is from AB to BC, the reaction pathway shown on fig. 11 is from right to left and increases. Therefore, this reaction is endothermic.
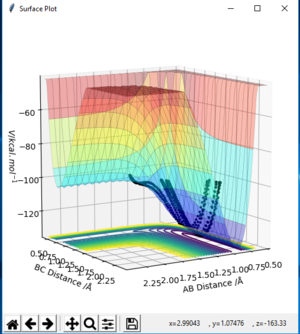
In the reaction of F + H2 to HF + H, H-H bond is broken and H-F bond is formed. Bond energy of breaking H-H is 436 kJ/mol. Bond energy of forming H-F bond is -565 KJ/mol. So the total energy is negative, which correspond to exothermic.
In the reaction of H + HF to H2 + F, H-F bond is broken and H-H bond is formed. Bond energy of breaking H-F is 565 kJ/mol. Bond energy of forming H-H bond is -436 KJ/mol. So the total energy is postive, which correspond to endothermic.
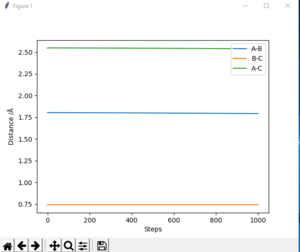
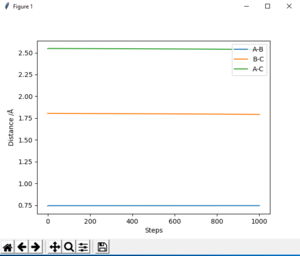
The estimated position of transition state is determined to be BC= 1.812 and AB=0.741 for H + HF to H2 + F
and BC= 0.741 , AB= 1.812 for H2 + F to H + HF (on fig. 14 and 15)
Good. Pu12 (talk) 23:00, 16 May 2019 (BST)
Q7 Report the activation energy for both reactions.
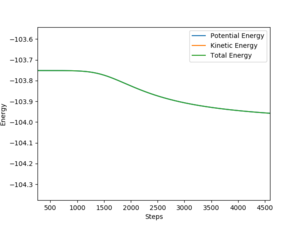
Activation energy of H2 + F to H + HF is the difference between the maximum and minimum of the two lines and equals to 0.189 kcal/mol
Activation energy of H + HF to H2 + F is the difference between the maximum and minimum of the two lines and equals to 33.17 kcal/mol
Your activation energies are correct but saying "two lines" does not make sense, you should talk about the energy at the transition state and the minimum energy when the graph becomes flat. Pu12 (talk) 23:00, 16 May 2019 (BST)
Q8 In light of the fact that energy is conserved, discuss the mechanism of release of the reaction energy. Explain how this could be confirmed experimentally.
Define atom A is fluorine, atom B and C are hydrogen atoms.
The condition is set to be AB= 1.509 Å, BC= 0.797 Å, AB momentum = -0.53, BC momentum = -0.87
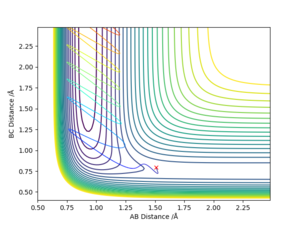
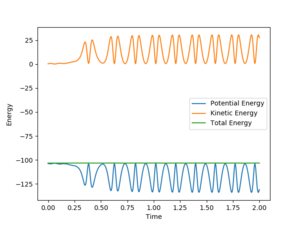
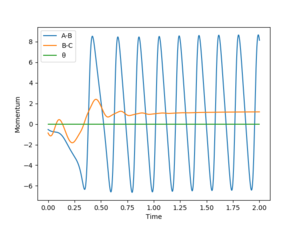
For the reaction H2 + F to H + HF, it is determined to be exothermic previously. Because the total energy is conserved, the kinetic energy must increase then. Therefore, the rise in kinetic energy can result in the temperature of the whole system increases. And the temperature can be checked experimentally by thermometer.
Using a calorimeter setup would be more accurate than just a thermometer and could give an energy value rather than just confirming that temperature changes and some quantity of thermal energy is released. Pu12 (talk) 23:00, 16 May 2019 (BST)
Q9 Discuss how the distribution of energy between different modes (translation and vibration) affect the efficiency of the reaction, and how this is influenced by the position of the transition state.
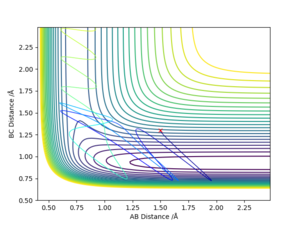
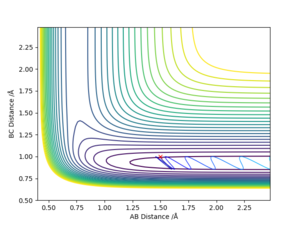
For the reaction of H + HF to H2 + F, it is endothermic. Therefore, the transition state resembles the product and have a late barrier.
For a late barrier, greater vibrational energy is more efficient than translational energy.
As can be seen on fig. 21, the vibrational energy is set to be large, hence the reaction happens. In fig. 22, translational energy is set to be large and then reaction cannot happen.
For successful reaction, the reaction is set to be AB=1.5 Å, BC=1.3 Å, AB momentum= -0.6, BC= -0.3, where A and B are hydrogen atoms and C is fluorine atom
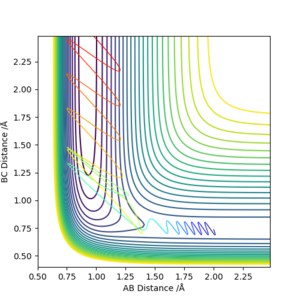
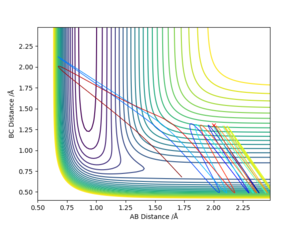
For the reaction of H2 + F to H + HF, it is exothermic. Therefore, the transition state resembles the reactants and have an early barrier.
For early barrier, greater translational energy is more efficient than vibrational energy.
As can be seen on fig. 23, the translational energy is set to be large, hence the reaction happens. In fig. 24, vibrational energy is set to be large and then reaction cannot happen.
For successful reaction, the reaction is set to be AB=2 Å, BC=0.74 Å, AB momentum= -0.7, BC= -1.5 where A is the fluorine atom, B and C are hydrogen atoms
Good, would help to mention Polanyi's rules. Pu12 (talk) 23:00, 16 May 2019 (BST)
References: Jeffery I. Steinfeld Joseph S. Francisco, William L.Hase, Experimental Chemical Dynamics, Chemical kinetics and dynamics, 2nd edition, vol 9.4.2 ,1998, P272-274.
Good report overall, well done. Pu12 (talk) 23:00, 16 May 2019 (BST)
