01217148
Optimised BH3 Molecule
B3LYP/6-31G(d,p)
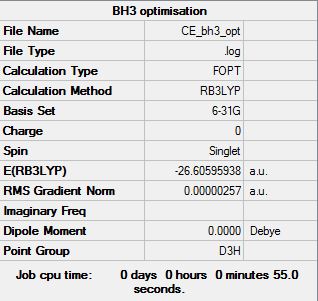
The optimisation of BH3:
The "item" table for BH3:
         Item               Value     Threshold  Converged?
 Maximum Force            0.000006     0.000450     YES
 RMS     Force            0.000003     0.000300     YES
 Maximum Displacement     0.000022     0.001800     YES
 RMS     Displacement     0.000011     0.001200     YES
The frequency file is linked here:File:CATHYEAGLE BH3 FREQ.LOG
Frequencies tabulated BH3 below:
 Low frequencies ---  -12.3889  -12.3823   -7.7287    0.0008    0.0237    0.4048
 Low frequencies --- 1162.9692 1213.1354 1213.1356
The optimised BH3 molecule:
test molecule |
Smf115 (talk) 16:41, 28 May 2018 (BST)All the necessary structure information is present, however, the energy of the BH3 molecule shown in the summary table is incorrect. It may have been taken from an earlier step in the optimisation and not of the final optimised structure.
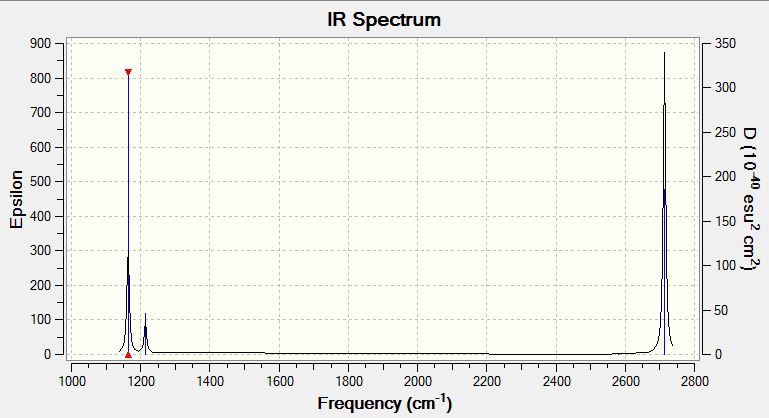
The IR spectral data for optimised BH3 is shown below:
 Mode    Frequency    Intensity    Symmetry      IR active?    Type

 1       1163         93           A2"           yes           out-of-plane bend
 2       1213         14           E'            slightly      in plane bend
 3       1213         14           E'            slightly      in plane bend
 4       2583         0            A1'           no            symmetric stretch
 5       2716         126          E'            yes           asymmetric stretch
 6       2716         126          E'            yes           asymmetric stretch
Vibrational modes 2/3 and 5/6 are degenerate so these only appear as a single peak. The intensity of the 2/3 appears much smaller than the 5/6 peaks, this is due to the stretching frequencies resulting in a larger change in dipole moment therefore higher intensity peak. Mode 4 is IR inactive since there is no change in dipole moment resulting from the symmetric stretch.
![Molecular Orbital diagram for BH3 [1]](/images/f/f9/Finalmo_ce.jpg)
There are no large differences between the real MO diagrams and the LCAO MOs, the shape, number of nodes and energy ordering is consistent. The only real difference being that the size of the actual MOs shows that they are more diffuse and larger than represented by the LCAO. This difference increases as the energy of the MOs increases and in the LCAO the contribution from the central B atom seems to be overestimated for the a1' anti-bonding MO.
This means that MO theory is extremely useful and sufficiently accurate to give a reasonable approximation as to the shape of the MOs, only the real MOs are just a larger and more diffuse. However, a little more knowledge is required to allow an appropriate energy ordering of the MOs when a molecular orbital diagram is drawn.
Smf115 (talk) 16:41, 28 May 2018 (BST)Clear inclusion of the MOs in the diagram and good discussion of both the similarities and differences.
Optimised NH3 Molecule
B3LYP/6-31G(d,p)
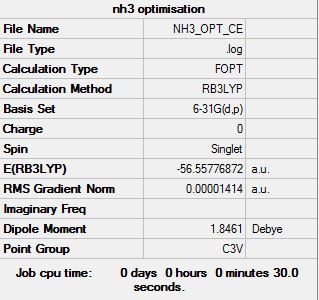
The optimisation of NH3:
The "item" table for NH3:
         Item               Value     Threshold  Converged?
 Maximum Force            0.000028     0.000450     YES
 RMS     Force            0.000014     0.000300     YES
 Maximum Displacement     0.000159     0.001800     YES
 RMS     Displacement     0.000084     0.001200     YES
The frequency file is linked here: File:NH3 OPT CE FREQ1.LOG
Frequencies tabulated NH3 below:
 Low frequencies ---   -0.0050   -0.0014   -0.0009   17.4186   17.4188   19.6420
 Low frequencies --- 1089.1064 1693.9379 1693.9379
The optimised NH3 molecule:
test molecule |
Optimised NH3BH3 Molecule
B3LYP/6-31G(d,p)
The optimisation of NH3BH3:
The "item" table for NH3BH3:
         Item               Value     Threshold  Converged?
 Maximum Force            0.000379     0.000450     YES
 RMS     Force            0.000106     0.000300     YES
 Maximum Displacement     0.001716     0.001800     YES
 RMS     Displacement     0.000619     0.001200     YES
The frequency file is linked here: File:NH3BH3 OPT FREQ CE.LOG
Frequencies tabulated NH3BH3 below:
 Low frequencies ---   -0.1316   -0.0056    0.0006    2.7940    9.1524    9.1570
 Low frequencies ---  263.3683  632.0980  638.7094
The optimised NH3BH3 molecule:
test molecule |
Energy of the Optimised Systems
E(BH3)= -26.61532 a.u.
E(NH3)= -56.55777 a.u.
E(NH3BH3)= -83.22469 a.u.
change in energy= E(NH3BH3)-[E(NH3)+E(BH3)]= -0.0516 a.u.= -135.48 kJ/mol
The B-N bond is weak. When compared to the energy required to break the bond in hyrodgen (~436kJ/mol) or nitrogen (~945kJ/mol) it is clearly far weaker[2].
BBr3 Optimisation
B3LYP/6-31G(d,p)LANL2DZ
BBr3 identifier: DOI:10042/202467
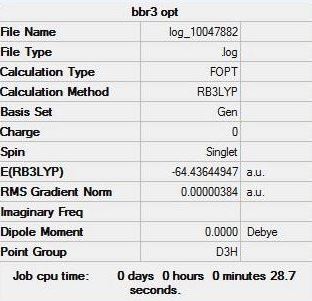
The optimisation of BBr3:
The "item" table for BBr3:
        Item               Value     Threshold  Converged?
 Maximum Force            0.000008     0.000450     YES
 RMS     Force            0.000004     0.000300     YES
 Maximum Displacement     0.000037     0.001800     YES
 RMS     Displacement     0.000018     0.001200     YES
The frequency file is linked here: File:Bbr3 freqanalysis.log
Frequencies tabulated BBr3 below:
 Low frequencies ---   -2.3055   -0.0029   -0.0018    0.0774    0.7534    0.7534
 Low frequencies ---  155.9402  155.9405  267.6894
The optimised BBr3 molecule:
test molecule |
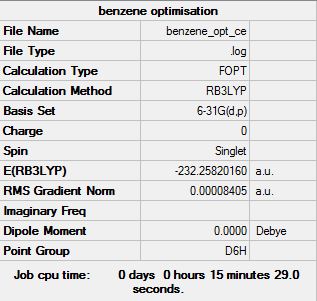
Benzene vs Borazine
B3LYP/6-31G(d,p)
Benzene Optimisation
The "item" table for benzene:
        Item               Value     Threshold  Converged?
 Maximum Force            0.000194     0.000450     YES
 RMS     Force            0.000077     0.000300     YES
 Maximum Displacement     0.000824     0.001800     YES
 RMS     Displacement     0.000289     0.001200     YES
Link to frequency file of benzene: File:BENZENE OPT CE FREQ.LOG
 Low frequencies ---  -16.9682  -14.6636  -14.6636   -0.0055   -0.0054    0.0003
 Low frequencies ---  414.1239  414.1239  620.9400
The optimised benzene molecule:
test molecule |
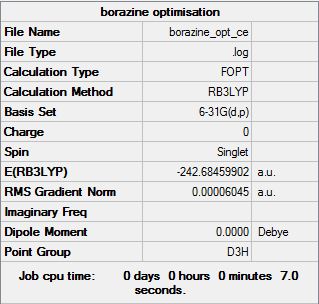
Borazine Optimisation
The "item" table for borazine:
         Item               Value     Threshold  Converged?
 Maximum Force            0.000191     0.000450     YES
 RMS     Force            0.000061     0.000300     YES
 Maximum Displacement     0.000293     0.001800     YES
 RMS     Displacement     0.000094     0.001200     YES
Frequency file: File:Borazine opt ce freq.log
 Low frequencies ---   -0.0330   -0.0138   -0.0036    2.9275    2.9307    4.0750
 Low frequencies ---  289.7198  289.7206  404.4180
The optimised borazine molecule:
test molecule |
Investigating Charge distribution
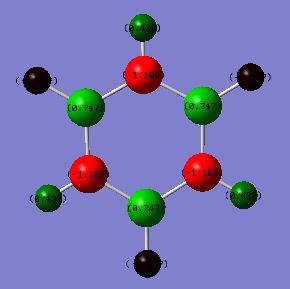
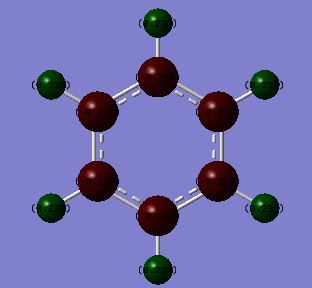
Borazine is isoelectronic with benzene. The distribution of charge in benzene is far less dramatic than that in borazine. This is represented by the shade difference of the atoms (the more dull/darker the colour, the less charged). The bright green and red boron, nitrogen and hyrdrogen atoms are present due to the large electronegativity difference between these atoms. Nitrogen is the most electronegative atom (3.07) in the molecule and so most of the negative charge resides on nitrogen atoms, leaving the boron (2.01) and hydrogen (2.1) atoms with a residual positive charge[3].
There is only a small electronegativity difference between the carbon (2.50) and hydrogen (2.10) atoms in benzene and so the charge distribution is more evenly distributed around the molecule. The carbon atoms have a slight negative charge (see below) and hydrogen atoms have a slight positive charge (see below). This supports the idea that there is a cloud of electrons above and below the plane of the ring.
Charges in Benzene:
C = -0.239
H = +0.239
Charges in Borazine:
N = -1.102
B = +0.747
H (bonded to N)= +0.432
H (bonded to B)= +0.747
The charges in each of the molecules adds up to 0. The more evenly distributed charge in benzene over borazine may provide an explanation as to why benzene is considered more aromatic than benzene.
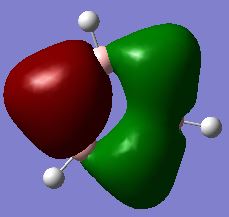
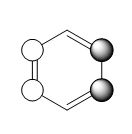
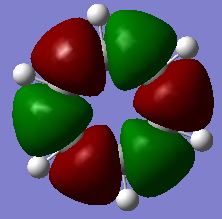
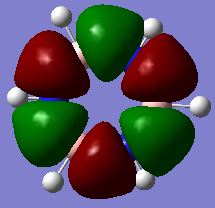
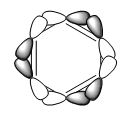
Molecular Orbitals
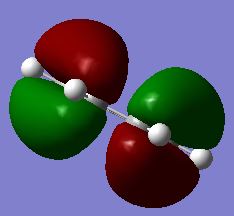
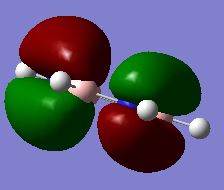
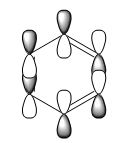
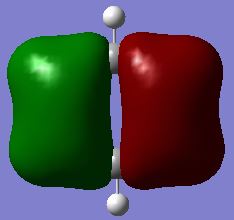
Smf115 (talk) 14:15, 1 June 2018 (BST)Comparable MOs selected and the LCAOs are a nice inclusion. To improve, details such as whether the MO is sigma- or pi- and its character should be considered for each MO and the differences between the MOs could be highlighted more.
The Concept of Aromaticity
Simply, aromaticity is the delocalisation of eletcrons within a system, resulting in a stabilisation. Beginning with benzene, then extended to other molecules (annulenes, aromatics ommitting benzene and inorganic alternatives), aromaticity does not require the restriction of planarity as was once thought and a compound can actually be three dimensional. Aromaticity has also been linked to the sigma-electron structure by some, since the true reason for the increased stability has eluded many[4].
There are four major consequences of aromaticity; more stable complexes, lower reactivity to addition (since the original molecule is already extremely stable), bond lengths are generally between the single and double bond length for the non aromatic analogue. Finally, aromatics display magnetic properties due to the network of delocalised electrons present. These four characteristics allow the identification of an aromatic compound, however, many sub-sets of aromaticity have been described (anti-,pseudo-, etc.)[5] so clearly this is only qualitative.
The energy difference between aromatic and non-aromatic analogues can allow an insight into the extent of aromaticity of a complex, however, this is often difficult to measure and calculate and even to attribute any energy difference to the fact that a molecule is aromatic. The overlap of pz atomic orbitals is a poor description for aromaticity since this purely takes into account the overlap of these orbitals, which is a large factor in compounds such as benzene, however, not the only MO which spreads electron density over the ring (third MO discussed). For non-planar compounds the overlap of these orbitals may not be significant. Overall, aromaticity can be thought of as a combination of the four factors (and potentially others e.g. sigma electron structures) and no single factor can be considered in isolation.
Smf115 (talk) 14:27, 1 June 2018 (BST)Some good points made with relevant and referenced examples and reference to the MOs visualised. To improve, a more thorough discussion of the simple concepts of aromaticity, such as Huckel's rule, would be nice and the points made need to be developed further.
Smf115 (talk) 14:27, 1 June 2018 (BST)Overall, a good report which just needs a bit more discussion in places in the project section.
References
- ↑ Dr Patricia Hunt, Lecture 4 Tutorial Sheet, Figure 5
- ↑ Y. R. Luo, Comprehensive Handbook of Chemical Bond Energies, CRC Press, Boca Raton, FL, 2007
- ↑ E. J. Little and M. M. Jones, Journal of Chemical Education, 1960, 37, 231
- ↑ Z. Chen, C. S. Wannere, C. Corminboeuf, R. Puchta and P. von Rague Schleyer, Chem. Rev, 2005, 105, 3842-3888
- ↑ M. Palusiak and T. M. Krygowski,Chem. Eur. J., 2007, 13, 7996-8006

