01198491Year2CompChemLab
Optimisations
BH3 Optimisation
Method and basis set: B3LYP/6-31G(d,p)
Summary Table:
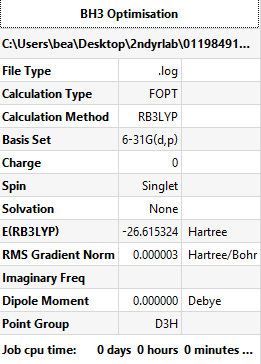
Item Table:
  Item               Value     Threshold  Converged?
 Maximum Force            0.000006     0.000450     YES
 RMS     Force            0.000004     0.000300     YES
 Maximum Displacement     0.000023     0.001800     YES
 RMS     Displacement     0.000015     0.001200     YES
Frequency Analysis Log File: https://wiki.ch.ic.ac.uk/wiki/images/5/57/01198491BH3FREQUENCY.LOG
Low Frequencies:
 Low frequencies ---   -0.9432   -0.8611   -0.0055    5.7455   11.7246   11.7625
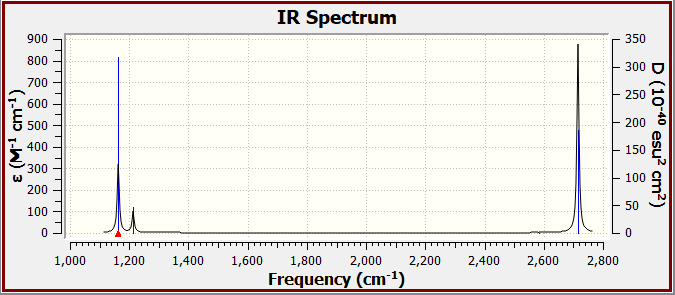
 Low frequencies --- 1162.9963 1213.1826 1213.1853
Jmol Image:
test molecule |
Table of Vibrations:
| Frequency (cm-1)
(given to 3sf as error is ± 10 cm-1) |
Intensity (arbitrary units)
(given to nearest integer) |
Symmetry | IR active? | Type |
|---|---|---|---|---|
| 1160 | 93 | A2" | Yes | Out-of-plane bend |
| 1210 | 14 | E' | Slightly | In-plane bend |
| 1210 | 14 | E' | Slightly | In-plane bend |
| 2580 | 0 | A1' | No | Symmetric stretch |
| 2720 | 126 | E' | Yes | Asymmetric stretch |
| 2720 | 126 | E' | Yes | Asymmetric stretch |
IR Spectrum:
There are only three peaks in the IR spectrum despite there being 6 possible vibrations (from 3N-6). This is because the vibration of frequency 2580 cm-1 is IR inactive (as it is a symmetric stretch which does not result in an overall dipole moment) so does not appear in the spectrum. Meanwhile there are also two sets of degenerate pairs, ie. the in-plane bends and asymmetric stretches with frequencies 1210 cm-1 and 2720 cm-1 respectively, which result in overlapping and therefore indistinguishable peaks in the IR spectrum. Therefore only three distinct peaks can be seen in the IR spectrum.
Well presented information with consideration of the accuracy of the reported values, your explaination for the 3 visible peaks is also very good! Smf115 (talk) 21:59, 15 May 2019 (BST)
MO Diagram:
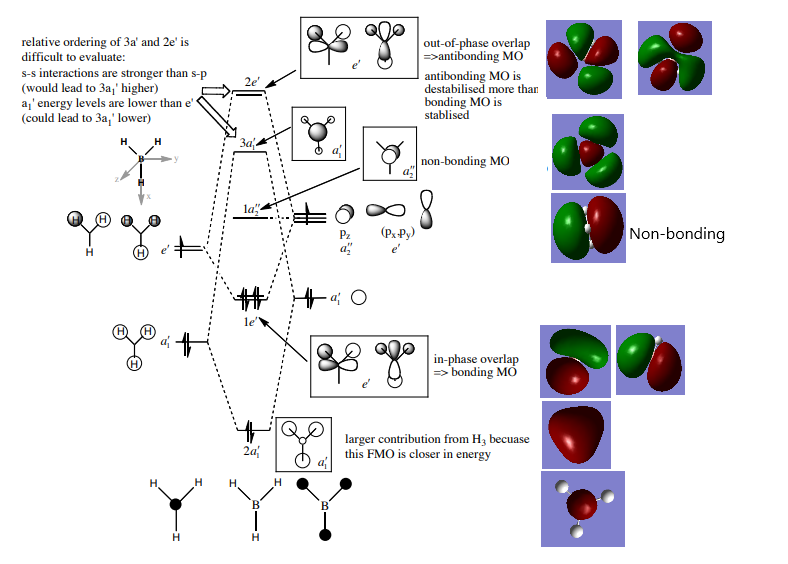
LCAO diagram provided by: P. Hunt, Lecture 4 Tutorial Notes, Figure.
The MO diagram above shows the MOs constructed from LCAO qualitative analysis on the left, with the MOs calculated using Gaussian on the right. The 1s AO on B is shown at the bottom, and does not interact with any orbitals on H due to being too low in energy, so is not shown in the LCAO diagram on the right. The real and LCAO MOs appear to be fairly similar for all of the bonding MOs (ie. 2a1' and the doubly degenerate 1e'), the non-bonding MO (a2"), and all the antibonding MOs (3a1' and the doubly degenerate 2e'), although the calculated MOs are more diffuse than those predicted from LCAO . The most significant difference between the real and LCAO MOs seems to be the size of the orbitals of the 3a1' MO, with LCAO predicting more electron density around the B atom, while the real MOs show that the electron density is actually greatest around the H atoms. It's difficult to tell if this discrepancy is also true for 2a1' even when viewing the MO using the mesh setting, because the constructive interference prevents the weighting of the H/B orbitals from being seen without re-running the calculations under different NBO settings. This indicates that qualitative MO theory is both accurate and useful in imaging MOs and arranging them in order of energy, although of course the actual MO energies cannot be found from this technique, and furthermore the size of the AO contributions to the final MO may not be as predicted from their relative energies.
Clear addition of the MOs on to the diagram and excellent analysis of the similarities and differences of the real and LCAO MOs Smf115 (talk) 22:08, 15 May 2019 (BST)
NH3 Optimisation
Method and basis set: B3LYP/6-31G(d,p)
Summary Table:
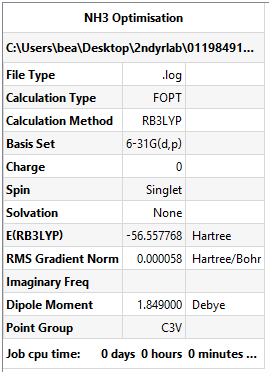
Item Table:
         Item               Value     Threshold  Converged?
 Maximum Force            0.000084     0.000450     YES
 RMS     Force            0.000054     0.000300     YES
 Maximum Displacement     0.000771     0.001800     YES
 RMS     Displacement     0.000454     0.001200     YES
Frequency Analysis Log File: https://wiki.ch.ic.ac.uk/wiki/index.php?title=File:01198491NH3OPTIMISATION3.LOG
Low Frequencies:
 Low frequencies ---  -12.3035  -12.3002   -2.9634   -0.0046    0.0318    0.1242
 Low frequencies --- 1092.1833 1694.3583 1694.3584
Jmol Image:
test molecule |
NH3BH3 Optimisation
Summary Table:
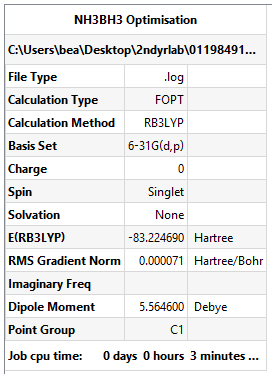
Item Table:
         Item               Value     Threshold  Converged?
 Maximum Force            0.000191     0.000450     YES
 RMS     Force            0.000053     0.000300     YES
 Maximum Displacement     0.001016     0.001800     YES
 RMS     Displacement     0.000409     0.001200     YES
Frequency Analysis Log File: https://wiki.ch.ic.ac.uk/wiki/index.php?title=File:01198491NH3BH3OPTIMISATION2.LOG
Low Frequencies:
 Low frequencies ---   -0.0010   -0.0008   -0.0004    4.9684   15.7491   30.4833
 Low frequencies ---  264.7685  632.4434  637.6342
Jmol Image:
test molecule |
NH3BH3 N-B Bond Dissociation Energy:
- E(BH3)= -26.615 AU (3dp as ±0.002)
- E(NH3)= -56.558 AU
- E(NH3BH3)= -83.225 AU
- ΔE = E(NH3BH3)-[E(NH3)+E(BH3)] = -83.225 - (-56.558 - 26.615) AU = -0.052 AU
(= -0.051598/3.8088x10-4 kJ/mol) = -135 kJ/mol (0dp as ± 5 kJ/mol)
Based on my energy calculations, the B-N dative bond is weak, because it has a bond dissociation energy which is much lower than the N-N covalent bond (BDE = 945 kJ/mol), B-B covalent bond (BDE = 297 kJ/mol), N-C covalent bond (BDE = 770 kJ/mol), or the B-C covalent bond (BDE = 448 kJ/mol). Bond dissociation values are from https://labs.chem.ucsb.edu/zakarian/armen/11---bonddissociationenergy.pdf. This means that little energy is required to break the B-N bond, so it is weak.
NI3 Optimisation
Method and basis set: B3LYP/6-31G(d,p)LANL2DZ
Summary Table:
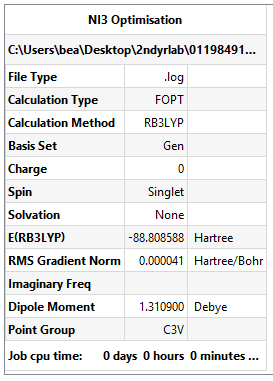
Item Table:
         Item               Value     Threshold  Converged?
 Maximum Force            0.000071     0.000450     YES
 RMS     Force            0.000047     0.000300     YES
 Maximum Displacement     0.000534     0.001800     YES
 RMS     Displacement     0.000354     0.001200     YES
Frequency Analysis Log File: https://wiki.ch.ic.ac.uk/wiki/index.php?title=File:01198491NH1OPTIMISATION.LOG
Low Frequencies:
 Low frequencies ---  -62.3258  -62.3226  -62.0183   -0.0147   -0.0079   -0.0074
 Low frequencies ---  134.1619  134.1653  196.3662
Jmol Image:
test molecule |
The N-I bond length is 2.184 Å (3dp as ± 0.001 Å).
Good implementation of the pseudopotential here for the optimisation, although your submitted frequency log file seems to have the incorrect energy suggesting that a mistake was made for this calculation. Smf115 (talk) 18:12, 19 May 2019 (BST)
Mini-Project: Ionic Liquids
N(CH3)4+ Optimisation
With Td symmetry imposed
Method and Basis Set: B3LYP/6-31G(d,p)
Summary Table:
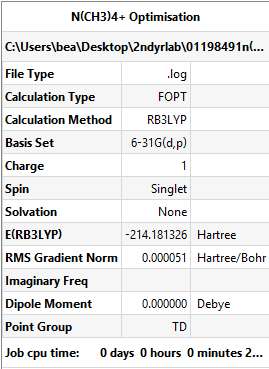
Item Table:
         Item               Value     Threshold  Converged?
 Maximum Force            0.000147     0.000450     YES
 RMS     Force            0.000060     0.000300     YES
 Maximum Displacement     0.001642     0.001800     YES
 RMS     Displacement     0.000639     0.001200     YES
Low Frequencies:
 Low frequencies ---   -0.0008   -0.0007   -0.0004   33.5608   33.5608   33.5608
 Low frequencies ---  215.9246  315.5855  315.5855
Frequency Analysis Log File: https://wiki.ch.ic.ac.uk/wiki/index.php?title=File:01198491NCH34OPTIMISATION2.LOG
Jmol Image:
test molecule |
Great detail making sure that the symmetries of the molecules are correct. Your structure information for both sections is really good, the only slight mistake is that the frequency summary tables should have been included instead of the optimisation. Smf115 (talk) 18:09, 19 May 2019 (BST)
P(CH3)4+ Optimisation
With Td symmetry imposed
Method and Basis Set: B3LYP/6-31G(d,p)
Summary Table:
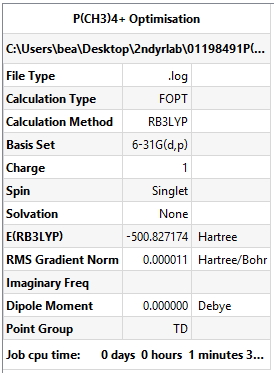
Item Table:
        Item               Value     Threshold  Converged?
 Maximum Force            0.000052     0.000450     YES
 RMS     Force            0.000012     0.000300     YES
 Maximum Displacement     0.000121     0.001800     YES
 RMS     Displacement     0.000089     0.001200     YES
Low Frequencies:
 Low frequencies ---   -0.0022   -0.0021   -0.0019   50.6234   50.6234   50.6234
 Low frequencies ---  187.9337  213.0177  213.0177
Frequency Analysis Log File: https://wiki.ch.ic.ac.uk/wiki/index.php?title=File:01198491PCH34OPTIMISATION1.LOG
Jmol Image:
test molecule |
NBO Charge Analysis
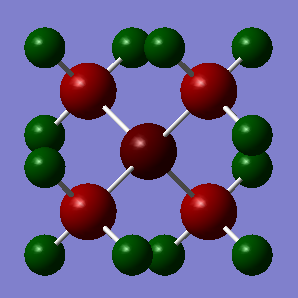
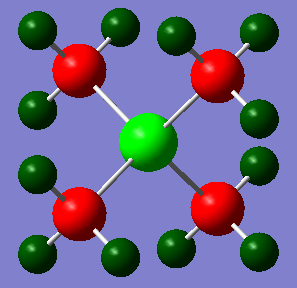
The NBO Charge Distributions for both N(CH3)4+ and P(CH3)4+ are shown above, with the depth of colour showing the extent of the charge on each atom. Red indicates a negative charge, while green indicates a postive charge.
In N(CH3)4+ the NBO Charges: N=-0.295, C=-0.483, H=0.269.
N (electronegativity of 3.04) is more electronegative than C (electronegativity of 2.55), so has a negative charge in the N(CH3)4+ NBO due to the covalent N-C bonds being polarised so that there is more electron density near the nitrogen nucleus (which has a higher effective nuclear charge, so that this polarisation makes the system lower energy and therefore more stable). This negative charge is not very high as it is offset by its cationic charge. Meanwhile, H (electronegativity of 2.20) is less electronegative than C, so the C-H covalent bonds are polarised towards C, giving H a positive charge in the N(CH3)4+ NBO. The C/H electronegativity difference is smaller than the N/C electronegativity difference, however H still has a significant NBO charge due to having no electron shielding (as all its electrons are in the C-H bond) so it has a very high effective nuclear charge.
In P(CH3)4+ the NBO Charges: P=1.667, C=-1.060, H=0.298
P (electronegativity of 2.19) has a lower electronegativity than N due to its extra shell of screening electrons, and is also less electronegative than C. This gives it a positive charge in the P(CH3)4+ NBO due to the covalent N-C bonds being polarised so that there is more electron density near the carbon nuclei (which have a higher effective nuclear charge, so that this polarisation makes the system lower energy and therefore more stable). Unlike in N(CH3)4+, this polarisation is enforced by the cationic charge, so the positive charge is to a great extent. The same electronegativity difference exists between C and H, so that the C-H covalent bonds are polarised towards the more electronegative C, giving H a positive charge in the P(CH3)4+ NBO, and C a negative charge, as in the N(CH3)4+ NBO. However, in the P(CH3)4+ NBO the C-H and P-C polarisations reinforce each other so result in C having a very negative charge, while in the N(CH3)4+ NBO the C-H and N-C polarisations oppose each other, so lead to charges being 'cancelled out' so that the atom charges are less extreme - the exception of course being the H atoms, which have largely the same charges in both structures due to having identical bonding.
Good calculation of the NBO charges and use of an equal colour range across both molecules for comparison. You are correct to compare the relative electronegativities to justify the charges (but literature values for the electronegativities need a reference!) and have proposed some other interesting ideas, however, these aren't quite correct. You may want to consider more what the effective nuclear charge actually is, some other effects such as symmetry, and the clarity of some of your arguments (e.g. what do you mean by reinforced by the cationic charge?). Although it is good to see some interesting ideas and consideration given to the question. Smf115 (talk) 18:26, 19 May 2019 (BST)
[NR4]+
[NR4]+ (R=alkyl) is often drawn as a tetrahedral structure, with the positive cationic charge localised on the nitrogen centre. This successfully represents one of N's 5 valence electrons having to be removed in order for it to form four bonds to carbon atoms and achieve a full (but not expanded) octet, ie. N is oxidised in the formation of this structure from N in an atomic state. Furthermore, the representation of [NR4]+ with a tetrahedral structure is shown to be accurate by the N(CH3)4+ Td symmetry.
However, the placing of the positive charge in the traditional interpretation of [NR4]+ is disputed by the NBO charge distribution (whose results are shown above). This is because the traditional structure with a formal positive charge on the N suggests that N had a charge of +1.000 - while the NBO charge distribution assigns the N atom a charge of -0.295 due to the N-C bond polarisation, giving C a more positive charge (although it is still negative it is less negative!), and making the H atoms the only positively charged atoms in the structure.
An ok attempt at describing the formal picture which could have been improved by considering Lewis bonding and formal electron counting. You state the discrepancy between the two but should have evaluated the validity of the formal charge description. Smf115 (talk) 18:34, 19 May 2019 (BST)
N(CH3)4+ Valence MOs
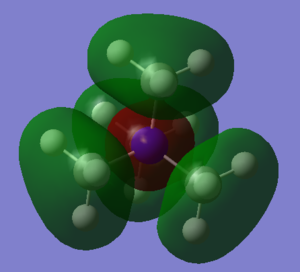
MO 10 occurs at -0.80746, and has both antibonding character between the N and C atoms, and bonding character between the C and H atoms. It is made from the out of phase overlap of the N s-orbital with four s-type fragment orbitals.

MO 15 occurs at -0.62251 and is made from the overlap of the fragment p-type orbitals, destructive in the x direction, and constructive in the y direction.
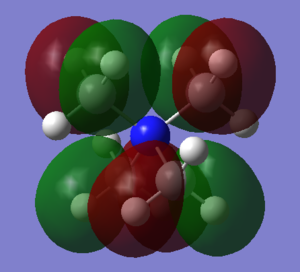
MOs 16, 17, 18 are degenerate at -0.58038 and have a large amount of antibonding character. They appear to be made from the destructive interference of the CH3 fragment p-orbitals, all of which are out of phase, and the MOs differ from each other due to using different x/y/z alignments for each specific methyl group.
I'm really sorry, my version of ChemDraw just kept crashing on me, and I've run out of time, so I've draw my LCAO representations by hand and taken a photo (below) - I'm also sorry it's so messy and done in a rush!
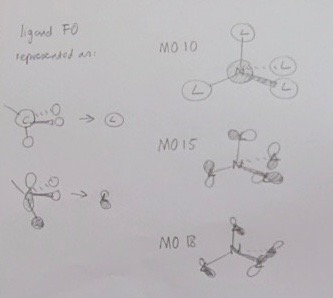
Your descriptions of the FOs which have formed the MOs are generally good, however, using sentences such as 'destructive in the x-direction...' are useless without an axis or frame of reference. You should have let the demonstrators in the session or contacted someone after the session, know about your ChemDraw problems as they would have been able to help. It would have been nice to see a more informative diagram (even hand drawn!). Smf115 (talk) 22:10, 20 May 2019 (BST)

