01108269
Introduction
The triatomic system is defined below. Before they collide, the bond length of B-C is r1; after collision, the bond length of new forming A-B is r2. Before collision, r1 stays approximately constant (oscillate slightly), and r2 decreases as they approach to each other. After collision, r2 stays constant and r1 tends to infinity. In the transition state, r1=r2. By changing the setting of initial distances and momentums of AB and BC, the trajectory the system can be calculated, weather the system had sufficient kinetic energy to overcome the activation barrier, and weather the energy is in the right vibrational modes can be determined.
EXERCISE 1: H + H2 system
Dynamics from the transition state region
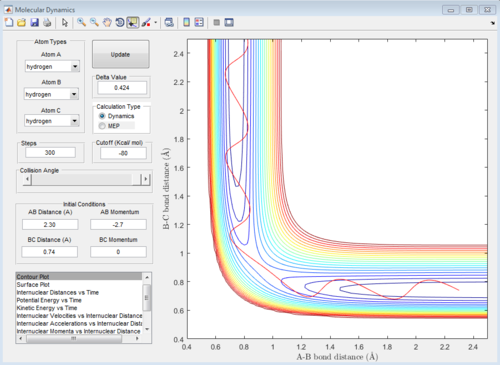
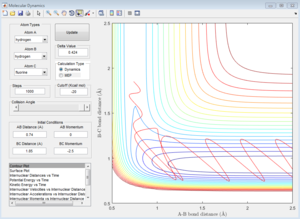
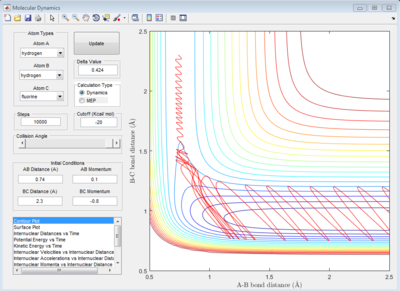
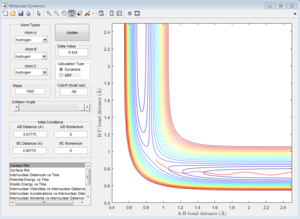
The initial conditions are set, and the graph is the contour plot. The red line is the trajectory.
On the potential energy surface, the gradient (first derivative) of reactant, product and transition state all equal to zero. The way which three points can be distinguished is the value of second derivative. For transition state, the saddle point in the graph, the second derivative is also zero, not for the reactant and product.
Also, if the graph was looked in 2D view, for transition state, ∂V (r1)/∂r1=0 and ∂V (r2) /∂r2=0; for the reactant, ∂V (r1)/∂r1=0 but ∂V (r2) /∂r2 is less than 0; for the product, ∂V (r1)/∂r1=0 but ∂V (r2) /∂r2 is less than 0.
(Fv611 (talk) 10:52, 30 May 2017 (BST) A lot of confusion here. Not sure by what you mean with "if the graph was looked in 2D view". Product and reactants are both minima, so their properties are the same. The first derivative is always zero at all ztationary points (minima and TS, which is a maxima). The difference is only in the second derivative, which is not zero for the transition state. You need to look over this again.)
Trajectories from r1 = r2: locating the transition state
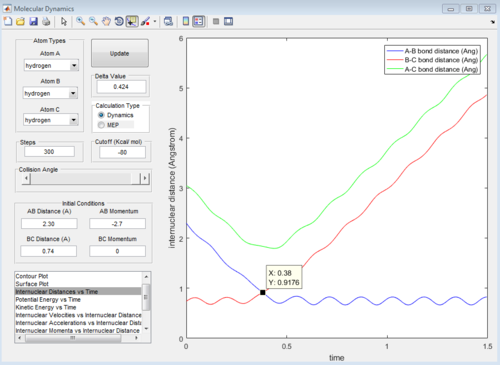
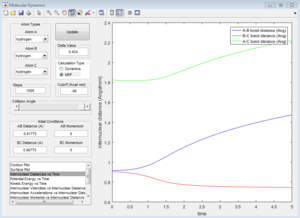
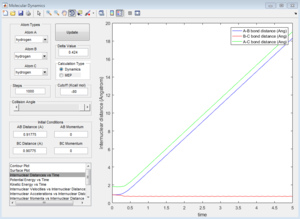
From the internuclear distance vs time plot, the time of transition state is the crossing point of A-B & B-C bond distance, which is 0.38. The corresponding internuclear distance is 0.9176.
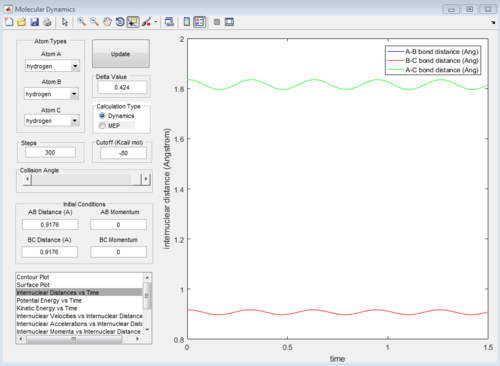
However, if the internuclear distance are set to 0.9176, and momenta are set to 0, the internuclear distance vs Time graph shows two oscillating curves, which is wrong.
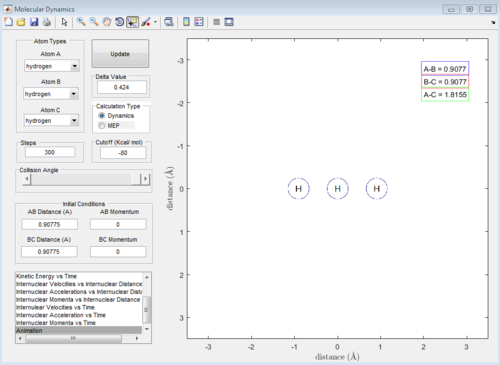
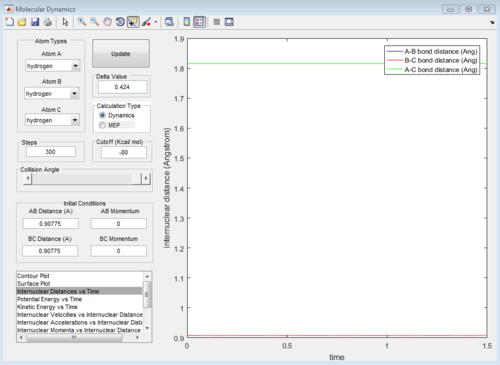
From the animation graph, when at transition state, three atoms do not move, and from the "internuclear distance vs time" plot, the distance do not change with time. The internuclear distance is tested to be 0.90775.
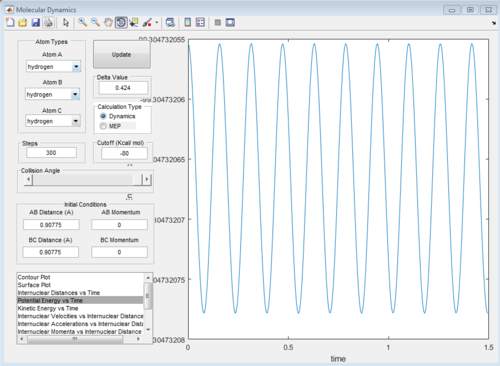
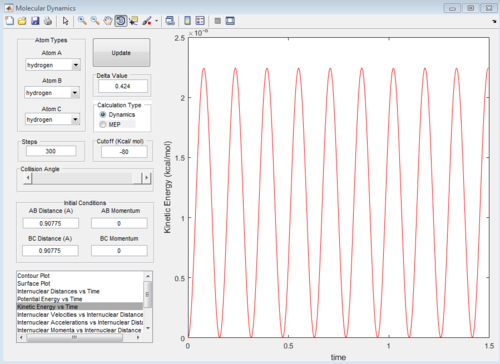
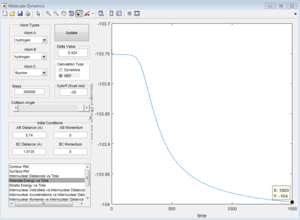
At transition state, total energy of the system is fixed, so potential energy and kinetic energy exchange between each other; both "Potential Energy vs Time" and "Kinetic Energy vs Time" graph show oscillating waves.
(Fv611 (talk) 10:52, 30 May 2017 (BST) You are not explaining why or how you went from 0.9176 to 0.90775. Also not that the total energy of the system is always fixed, not only at the transition state.)
Trajectories from r1 = rts+δ, r2 = rts
B-C distance: 0.90775, A-B distance 0.91775, p1 = p2 = 0
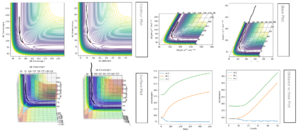
MEP calculation
|
|
|
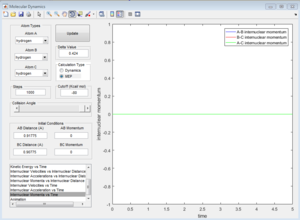
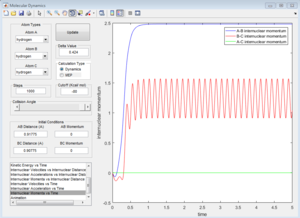
| Contour Plot | Internuclear Distance vs Time | Internuclear Momenta vs Time |
Dynamics calculation
| Average internuclear momentum | Average internuclear distance | |
|---|---|---|
| A and B | 2.481 | 5.281 |
| B and C | 1.241 | 0.7432 |
|
|
|
| Contour Plot | Internuclear Distance vs Time | Internuclear Momenta vs Time |
How are they different
In the progress, distance between A and B increases, while distance between B and C decreases. Eventually B-C bond forms. In dynamic calculation, the formation of B-C bond converted translational energy into vibrational energy. As a result, the vibrational energy cause B-C bond oscillate. If a proton is placed very near to the transition state, the reaction would happen automatically. In MEP calculation, B-C does not have vibrational evergy because the intermolecular momentum is zero. Although a little delta distance is given away from the transition state, the proton would not go downhill, and the reaction would not take place.
(Fv611 (talk) 10:52, 30 May 2017 (BST) The difference between mep and dynamic calculations lies in how they treat velocities.)
Reactive and unreactive trajectories
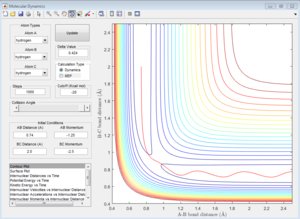
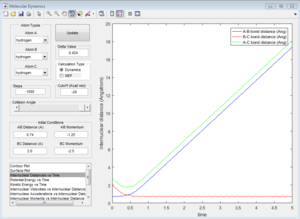
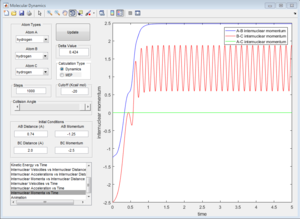
r1=0.74 r2=2.0
Group 1
p1=-1.25 p2=-2.5
|
|
|
| Coutour Plot | Internuclear distance vs time | Internuclear momenta vs time |
Reactive trajectory. The trajectory passes though the transition state, which indicates that it has sufficient energy to overcome the activation energy.
Group 2
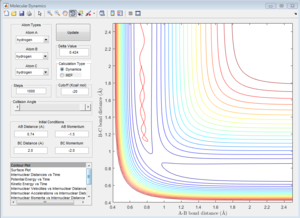
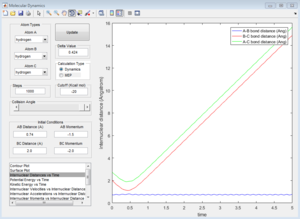
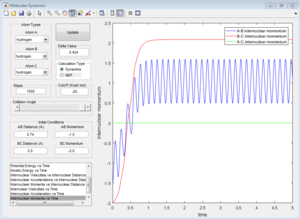
p1=-1.5 p2=-2.0
|
|
|
| Coutour Plot | Internuclear distance vs time | Internuclear momenta vs time |
Unreactive trajectory. The trajectory path reverses back to A-B. The B-C internuclear momentum is not oscillating, so no B-C bond forms.
Group 3
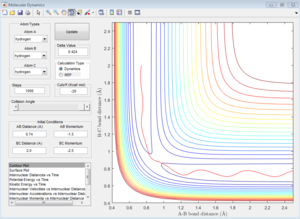
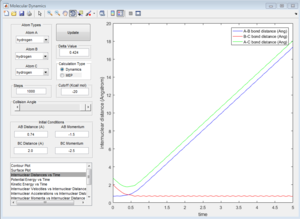
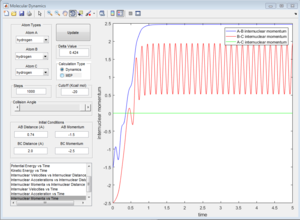
p1=-1.5 p2=-2.5
|
|
|
| Coutour Plot | Internuclear distance vs time | Internuclear momenta vs time |
Reactive trajectory. The trajectory passes though the transition state, which indicates that it has sufficient energy to overcome the activation energy.
Group 4
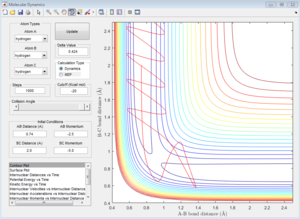
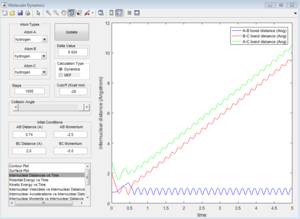
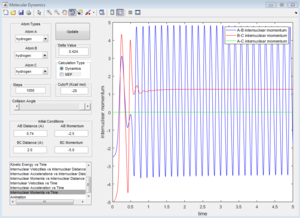
p1=-2.5 p2=-5.0
|
|
|
| Coutour Plot | Internuclear distance vs time | Internuclear momenta vs time |
Unreactive trajectory, The trajectory path reverses back to A-B. The reactant overcome the energy barrier to the product but reforms back. The momentum plot indicates that B-C bond forms initially, but breaks down then.
Group 5
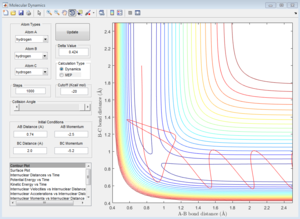
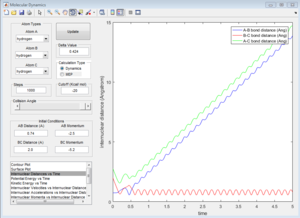
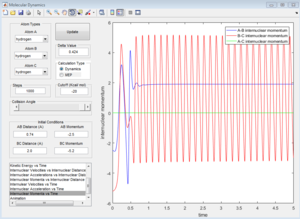
p1=-2.5 p2=-5.2
|
|
|
| Coutour Plot | Internuclear distance vs time | Internuclear momenta vs time |
Reactive trajectory. The trajectory passes though the transition state, which indicates that it has sufficient energy to overcome the activation energy.
(Fv611 (talk) 10:52, 30 May 2017 (BST) Ok. More discussion would have been better. For example, why are reaction 1 and 3 different?)
Transition state theory
Transition state indicates that once the reactant overcomes the activation barrier, it forms product. This assumption is correct for most cases. However, during the test, system 5 has sufficient energy to overcome the barrier. Initially product forms, but then breaks down and reforms the reactant. Because of this, weather the energy is in correct mode is very important. In this case, the vibrational direction is essential.
(Fv611 (talk) 10:52, 30 May 2017 (BST) Not enough discussion. Missing an important part on how TST describes (or does not describe) quantum effects. Why is the vibrational direction important when the reactants are reformed?)
EXERCISE 2: EXERCISE 2: F - H - H system
PES inspection
Endothermic or Exothermic
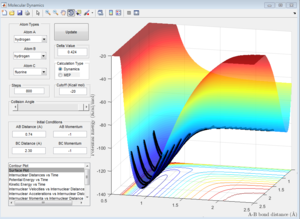
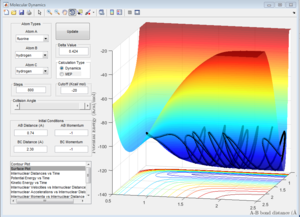
The F-H-H system can be considered into two circumstances. One is a hydrogen atom approaches H-F molecule, the other is fluorine atom approaches H-H molecule. The factor which decides whether this reaction is endothermic or exothermic is the bond energy; the H-F bond energy is much larger than that of H-H bond. When F approaches H-H, this reaction should be exothermic due to energy release by the formation of strong H-F bond. When H approaches H-F, the condition reverses, so it should be endothermic.
|
|
| F approaches H-H (Exothermic) | H approaches H-F (Endothermic) |
When F approaches H-H, the potential energy of the product is lower than that of reactant, which means this reaction is exothermic. As H approaches H-F, the product has higher energy, which means the reaction is endothermic.
Approximate position of the transition state
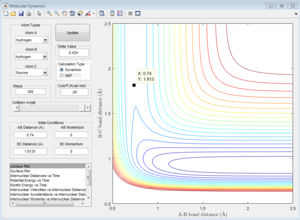
The bond length of H2 is 0.74 A.
|
|
| F-H-H transition state Contour Plot | F-H-H transition state Internuclear Distance vs Time |
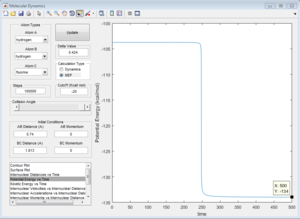
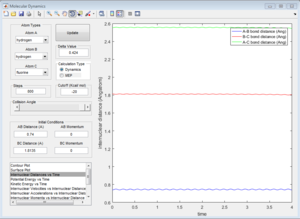
As the graph "F-H-H transition state Contour Plot" shows, when the momenta of both molecule are zero, the trajectory is a single point, which means the three atoms are in the transition state. Therefore, the internuclear distance between H and F is 1.8135 A. As the graph "F-H-H transition state Internuclear Distance vs Time" shows, the internuclear distance does not change with time, which alternatively shows that the system is in transition state.
(Fv611 (talk) 10:52, 30 May 2017 (BST) How did you guess these TS bond distances?)
Determination of Activation energy for both reaction
F + H2 model
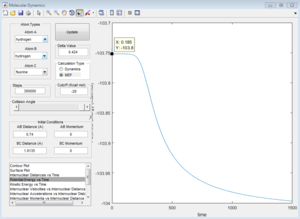
Activation energy = -103.8-(-1.4.0) = +0.2 kcal/mol
H + HF model
Activation energh = -103.7-(-134) = +30.3 kcal/mol
Reaction dynamics
F + H2
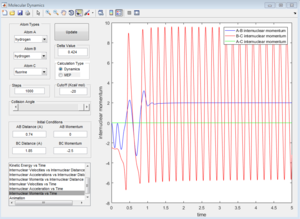
As the "Internuclear Momenta vs Time" shows, initially H-H internuclear momentum vibrates. When F approaches, H-F bond forms and the energy dissipates into H-F bond, causing vibration of H-F bond. As time goes, the H-H internuclear momentum stays constant, and H-F internuclear momentum oscillates.
(Fv611 (talk) 10:52, 30 May 2017 (BST) You are not answering the question. How does this relate to the conservation of energy? How would you measure this experimentally?)
|
|

|
|
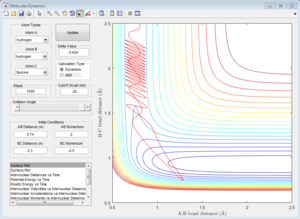
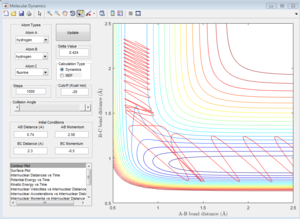
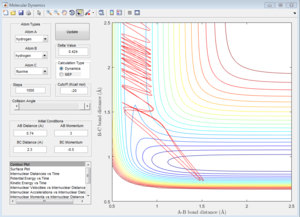
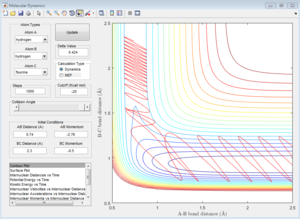
| pHH=2 | pHH=2.56 | pHH=2.63 | pHH=3 |
For reactive trajectories, the positive range of H-H momentum is from 2.56 A to 2.63 A.
|
|
|
|
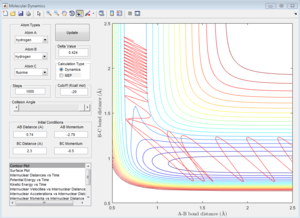
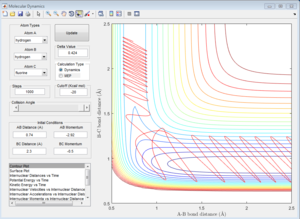
| pHH=-2.76 | pHH=-2.79 | pHH=-2.92 | pHH=-2.95 |
For negative H-H momentum, there is no range but 4 distinct momenta: -2.76, -2.79, -2.92, and -2.95.
For the same initial position, pFH = -0.8, and pHH = 0.1, the trajectory is still reactive by giving large step number, even though the initial momentum is very small.
H + HF

|
|
|
| Unreactive | Unreactive | Reactive |
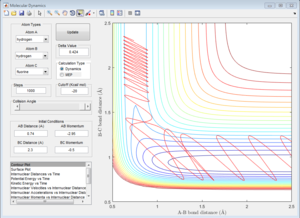
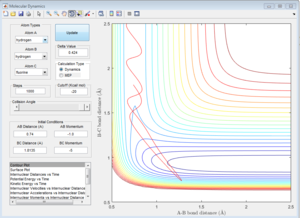
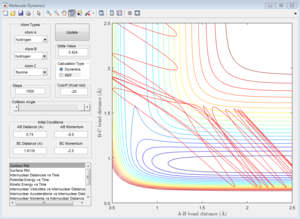
In the system of H + H-F, whether the reaction takes place depends on the translational energy of the H, which represented by its momentum, and the vibrational energy of H-F. If the vibrational energy of H-F is not enough, increases the translational energy of H will not make the reaction proceed.Because the reaction is endothermic, the structure of the transition state ensembles the product. If the reaction is exothermic, the transition state will ensembles the reactant, which has different impact on the energy modes.
(Fv611 (talk) 10:52, 30 May 2017 (BST) You are not answering the question. How does the distribution of energy between modes impact the efficiency of the reaction? How does that relate to the position of the TS? Can find some information in the original text http://science.sciencemag.org/content/sci/236/4802/680.full.pdf)


