
Uploads by Am9017
This special page shows all uploaded files.
| Date | Name | Thumbnail | Size | Description | Versions |
|---|---|---|---|---|---|
| 14:19, 7 March 2018 | Anuj Mehra PHunt nh3 optf pop.gjf (file) | 471 bytes | 2 | ||
| 14:26, 7 March 2018 | ANUJ MEHRA PHUNT NH3 OPTF POP.LOG (file) | 228 KB | 1 | ||
| 15:05, 7 March 2018 | Anuj mehra nh3 vibrations.docx (file) | 164 KB | 1 | ||
| 18:24, 8 March 2018 | Anuj mehra H2 vibrations.png (file) |  |
13 KB | 2 | |
| 18:27, 8 March 2018 | Anuj mehra nh3 vibrations.png (file) |  |
15 KB | 2 | |
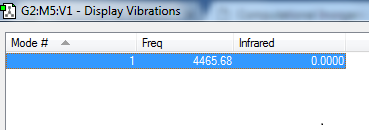
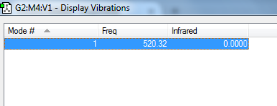
| 18:32, 8 March 2018 | Anuj mehra n2 vibrations.png (file) |  |
12 KB | 4 | |
| 10:15, 9 March 2018 | Anuj mehra N2 1s core orbital.png (file) |  |
102 KB | 1 | |
| 10:38, 9 March 2018 | Anuj mehra N2 2s bonding orbital.png (file) |  |
72 KB | 1 | |
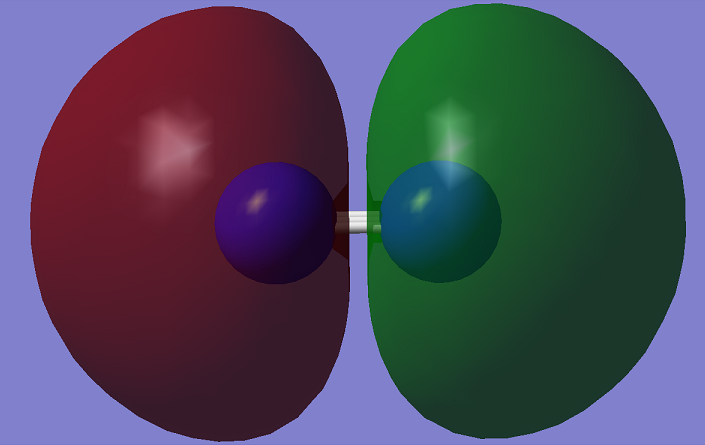
| 10:58, 9 March 2018 | Anuj mehra N2 2s antibonding orbital.png (file) |  |
131 KB | 1 | |
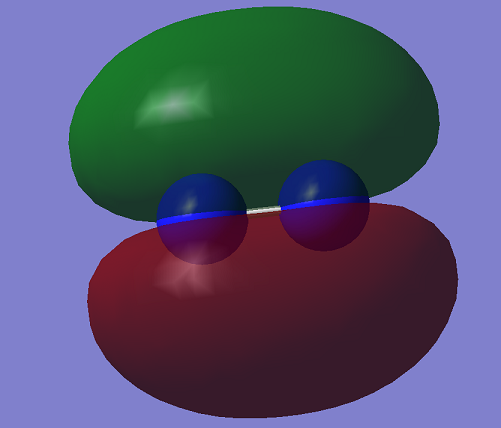
| 11:33, 9 March 2018 | Anuj mehra N2 2p pi orbital.png (file) |  |
85 KB | 1 | |
| 12:04, 9 March 2018 | ANUJ MEHRA PHUNT H2 OPTF POP.LOG (file) | 95 KB | 1 | ||
| 12:08, 9 March 2018 | ANUJ MEHRA PHUNT N2 OPTF POP.LOG (file) | 196 KB | 1 | ||
| 12:21, 9 March 2018 | ANUJ MEHRA PHUNT CL2 OPTF POP.LOG (file) | 268 KB | 1 | ||
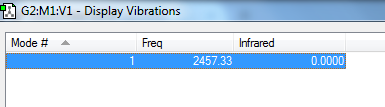
| 12:28, 9 March 2018 | Anuj mehra Cl2 vibrations.png (file) |  |
10 KB | 1 | |
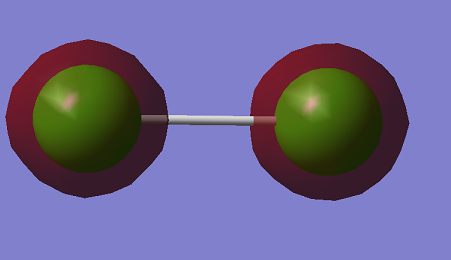
| 13:59, 9 March 2018 | Anuj mehra Cl2 2s bonding orbital.png (file) |  |
46 KB | 1 | |
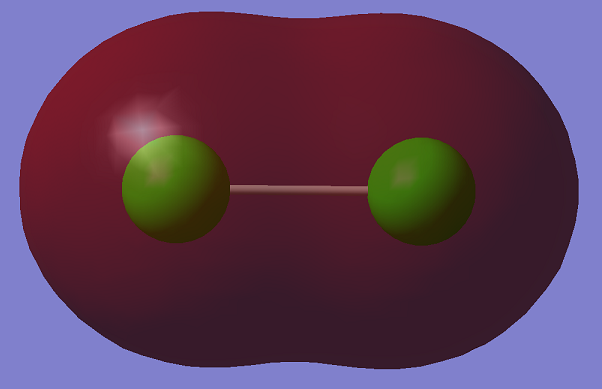
| 14:18, 9 March 2018 | Anuj mehra Cl2 3s bonding orbital.png (file) |  |
93 KB | 1 | |
| 14:29, 9 March 2018 | Anuj mehra Cl2 3p bonding orbital.png (file) |  |
129 KB | 1 | |
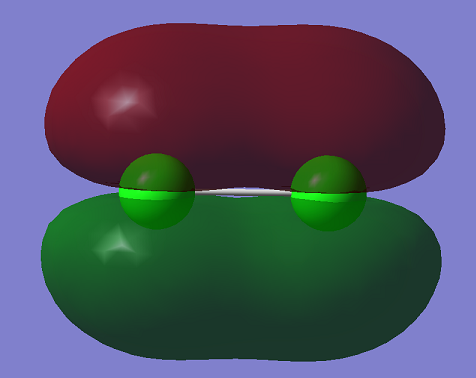
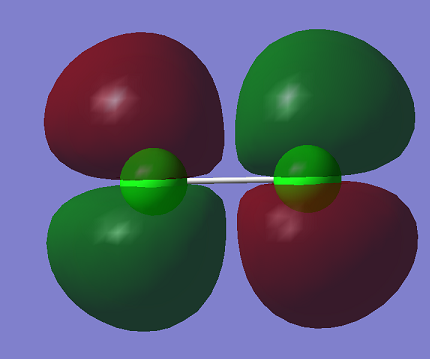
| 14:42, 9 March 2018 | Anuj mehra Cl2 3p pi bonding orbital.png (file) |  |
78 KB | 1 | |
| 14:52, 9 March 2018 | Anuj mehra Cl2 3p antibonding orbital.png (file) |  |
75 KB | 1 | |
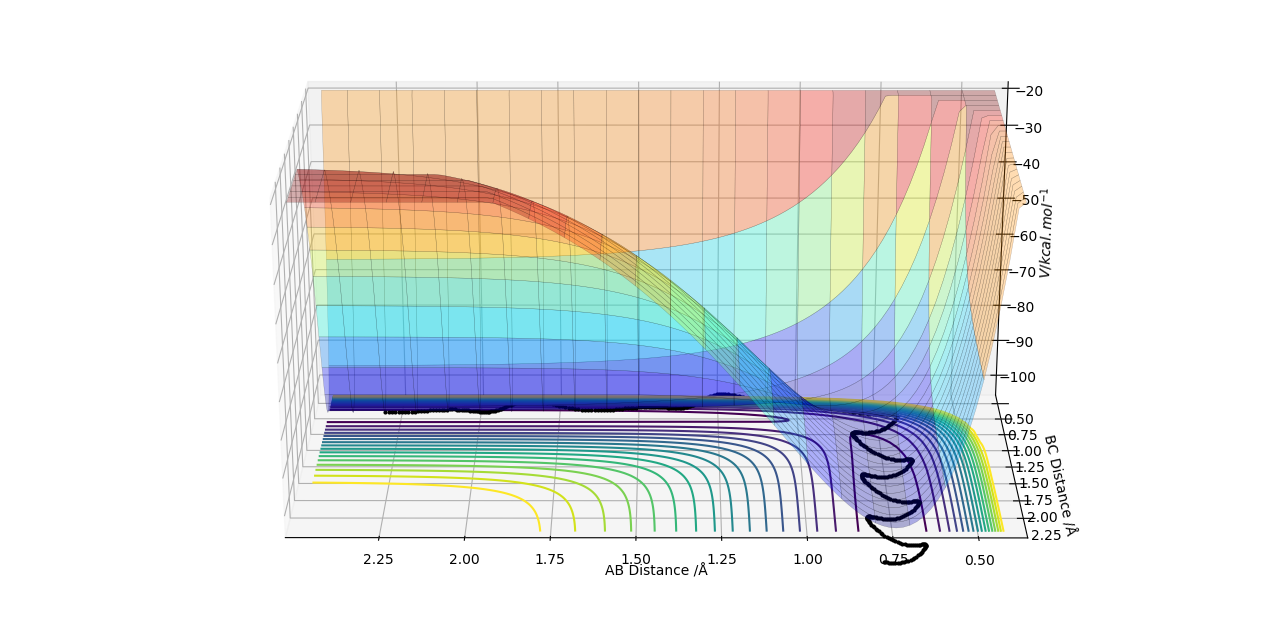
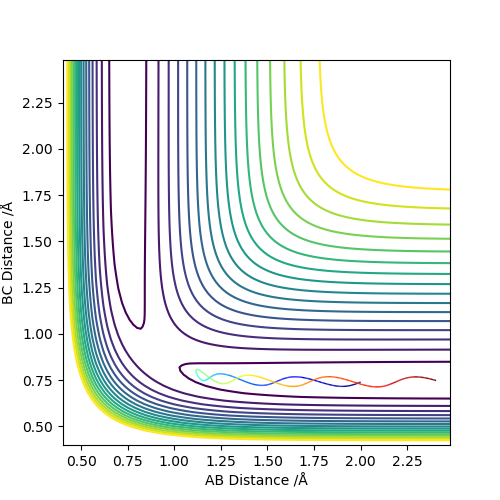
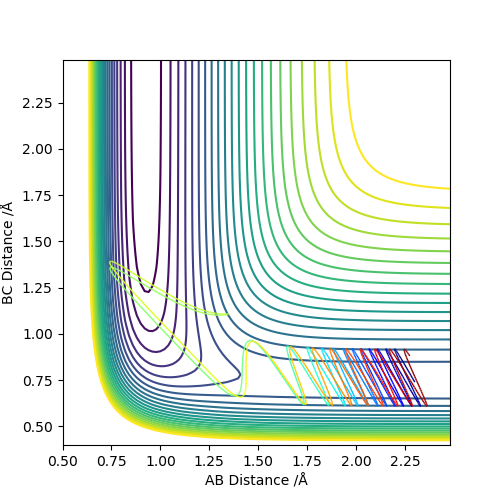
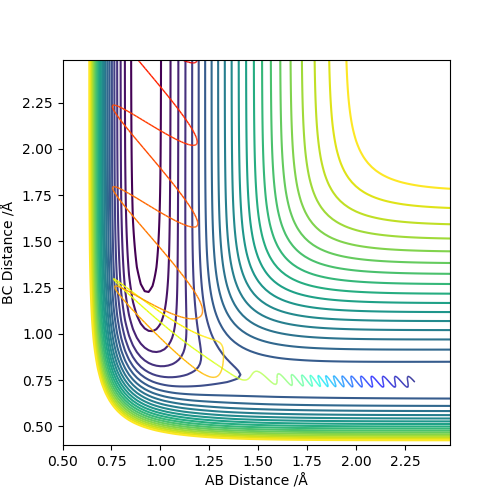
| 17:26, 8 May 2019 | Am9017 surface plot.png (file) |  |
154 KB | Surface plot of the reaction between A and BC. The black line at the bottom is the trajectory followed by the system. Red/Yellow mean high potential energy and blue means low potential energy. | 1 |
| 17:34, 8 May 2019 | Am9017 Surface Plot.png (file) |  |
265 KB | 1 | |
| 17:22, 9 May 2019 | Rts value am9017.png (file) |  |
11 KB | 1 | |
| 10:56, 10 May 2019 | Dynamic contour plot am9017.png (file) |  |
112 KB | 1 | |
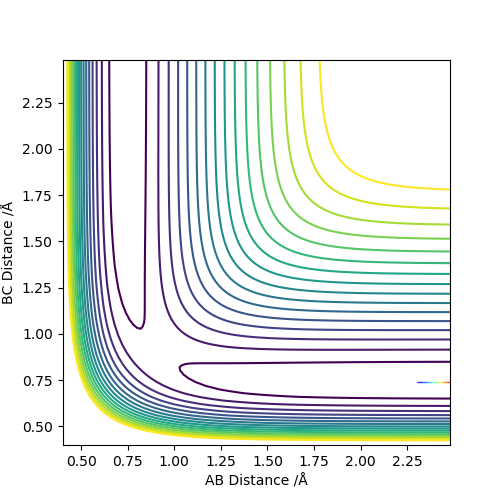
| 10:56, 10 May 2019 | Mep contour plot am9017.png (file) |  |
106 KB | 1 | |
| 11:32, 10 May 2019 | No plot 1 am9017.png (file) |  |
109 KB | 1 | |
| 11:41, 10 May 2019 | Yes plot 2 am9017.png (file) |  |
112 KB | 1 | |
| 11:50, 10 May 2019 | Yes plot 1 am9017.png (file) |  |
112 KB | 3 | |
| 11:54, 10 May 2019 | No plot 2 am9017.png (file) |  |
214 KB | 1 | |
| 12:01, 10 May 2019 | Yes plot 3 am9017.png (file) |  |
116 KB | 1 | |
| 13:37, 10 May 2019 | Surface plot h2 f am9017.png (file) |  |
159 KB | 1 | |
| 14:05, 10 May 2019 | Ts plot am9017.png (file) |  |
109 KB | 1 | |
| 14:33, 10 May 2019 | Ts plot zoomed in am9017.png (file) |  |
14 KB | 2 | |
| 14:34, 10 May 2019 | Activation energy am9017.png (file) |  |
20 KB | 1 | |
| 14:59, 10 May 2019 | Activation energy zoomed in am9017.png (file) |  |
30 KB | 1 | |
| 15:57, 10 May 2019 | Full rxn am9017.png (file) |  |
42 KB | 1 | |
| 16:30, 10 May 2019 | Forward incomplete rxn am9017.png (file) |  |
134 KB | 1 | |
| 16:31, 10 May 2019 | Forward complete rxn am9017.png (file) |  |
124 KB | 1 | |
| 16:47, 10 May 2019 | Backward rxn incomplete am9017.png (file) |  |
122 KB | 1 | |
| 16:50, 10 May 2019 | Backward rxn complete am9017.png (file) |  |
130 KB | 1 | |
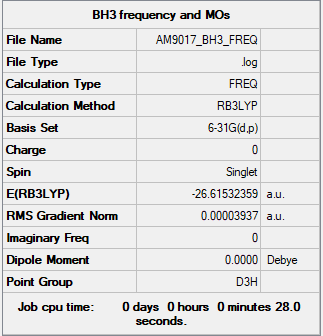
| 15:31, 14 May 2019 | Am9017 bh3 summary.PNG (file) |  |
11 KB | 2 | |
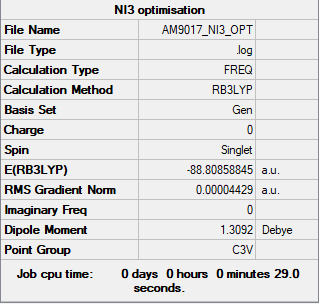
| 13:51, 16 May 2019 | AM9017 NI3 OPT.LOG (file) | 66 KB | 1 | ||
| 17:12, 16 May 2019 | AM9017 BH3 FREQ.LOG (file) | 73 KB | 1 | ||
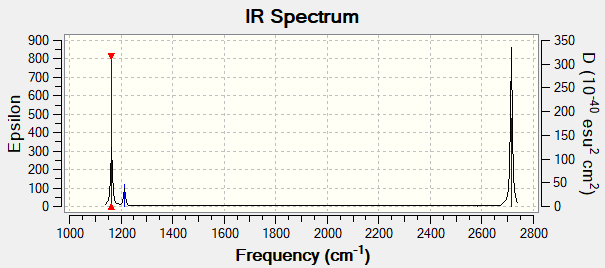
| 18:19, 16 May 2019 | Am9017 bh3 ir.PNG (file) |  |
12 KB | 1 | |
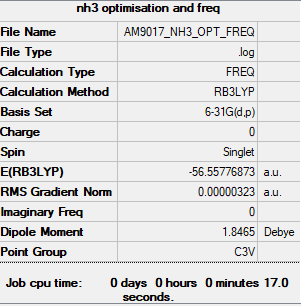
| 10:08, 17 May 2019 | Am9017 nh3 summary table.PNG (file) |  |
11 KB | 1 | |
| 10:24, 17 May 2019 | AM9017 NH3 OPT FREQ.LOG (file) | 71 KB | 1 | ||
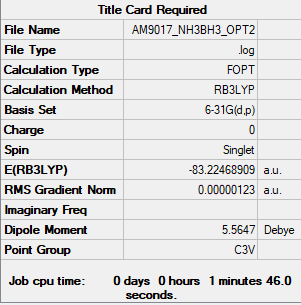
| 10:57, 17 May 2019 | AM9017 NH3BH3 summary table.PNG (file) |  |
11 KB | 1 | |
| 11:03, 17 May 2019 | AM9017 NH3BH3 FREQ2.LOG (file) | 182 KB | 1 | ||
| 11:12, 17 May 2019 | Am9017 NI3 summary table.PNG (file) |  |
11 KB | 1 | |
| 11:38, 17 May 2019 | AM9017 N(CH3)4 OPT FREQ.LOG (file) | 1.17 MB | 1 | ||
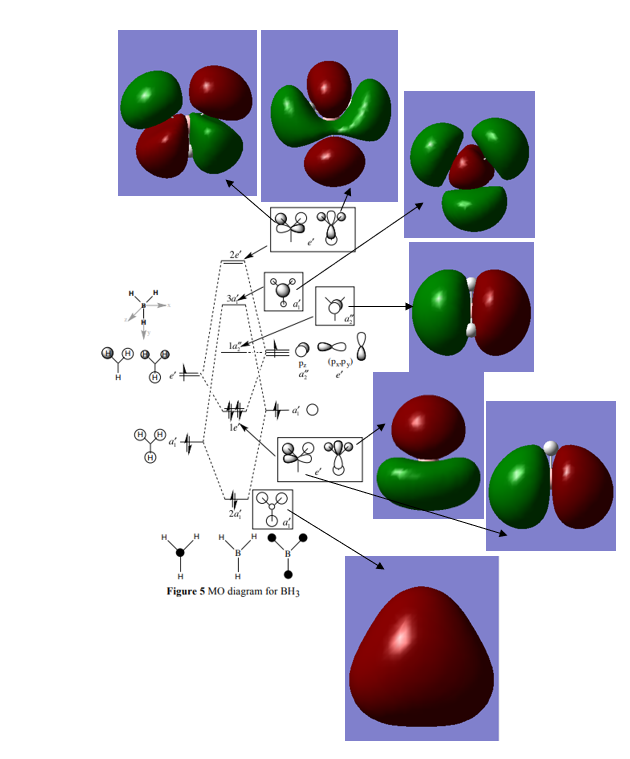
| 12:27, 17 May 2019 | Am9017 bh3 MO.PNG (file) |  |
155 KB | 1 |