
Uploads by Zn4318
This special page shows all uploaded files.
| Date | Name | Thumbnail | Size | Description | Versions |
|---|---|---|---|---|---|
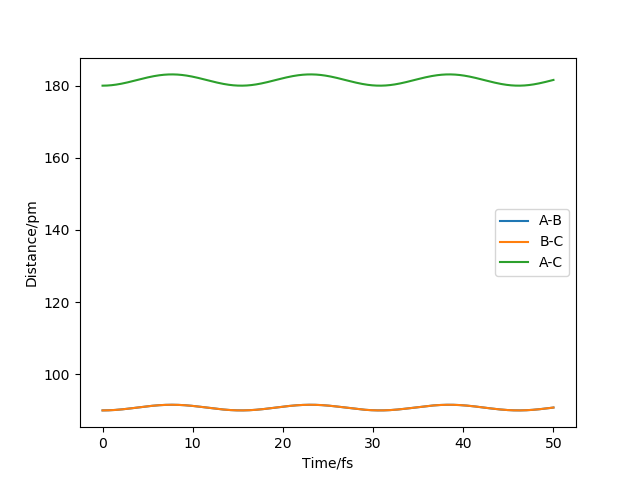
| 22:07, 22 May 2020 | ZN 01510257 Q9 Figure 4.png (file) |  |
56 KB | Energy vs time plot of successful HF formation | 1 |
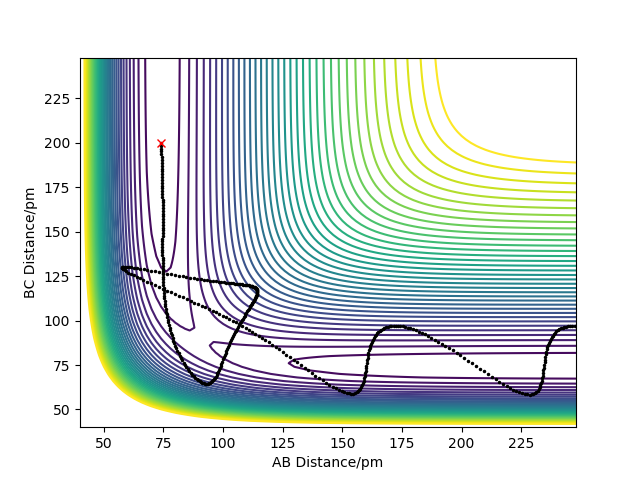
| 22:04, 22 May 2020 | ZN 01510257 Q9 Figure 2.png (file) |  |
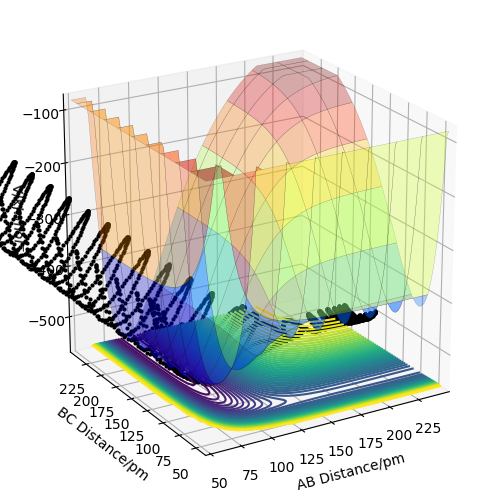
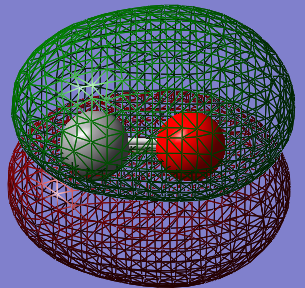
168 KB | Surface plot of successful F + H2 reaction | 1 |
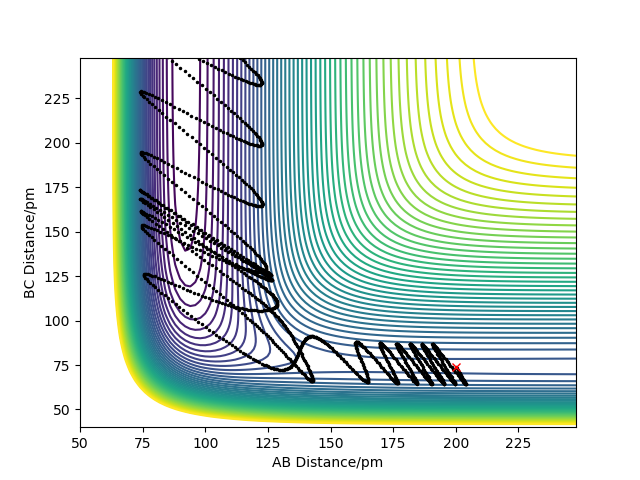
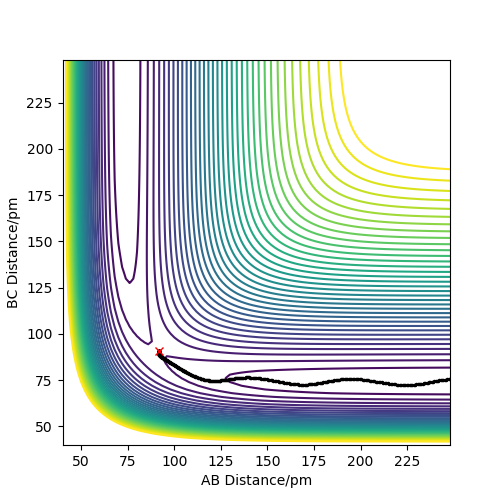
| 21:58, 22 May 2020 | ZN 01510257 Q9 Figure 1.png (file) |  |
203 KB | Contour plot for a successful F + H2 trajectory. | 1 |
| 21:49, 22 May 2020 | ZN 01510257 Q10 Figure7 2.gif (file) |  |
718 KB | The 7th gif in the table | 1 |
| 21:47, 22 May 2020 | ZN 01510257 Q10 Figure6 2.gif (file) |  |
646 KB | The 6th gif in the table | 1 |
| 21:46, 22 May 2020 | ZN 01510257 Q10 Figure5 2.gif (file) |  |
1.38 MB | The 5th gif in the table | 1 |
| 21:45, 22 May 2020 | ZN 01510257 Q10 Figure4 2.gif (file) |  |
642 KB | The 4th gif in the table | 1 |
| 21:44, 22 May 2020 | ZN 01510257 Q10 Figure3 2.gif (file) |  |
715 KB | The 3rd gif in the table | 1 |
| 21:44, 22 May 2020 | ZN 01510257 Q10 Figure2 2.gif (file) |  |
508 KB | The second gif in the table | 1 |
| 21:43, 22 May 2020 | ZN 01510257 Q10 Figure1 2.gif (file) |  |
694 KB | The 1st gif in the table | 1 |
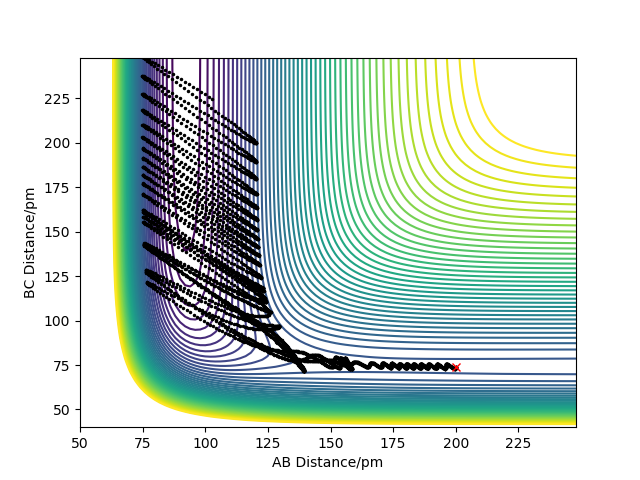
| 21:42, 22 May 2020 | ZN 01510257 Q10 Figure 7 1.png (file) |  |
203 KB | The 7th contour plot in the table | 1 |
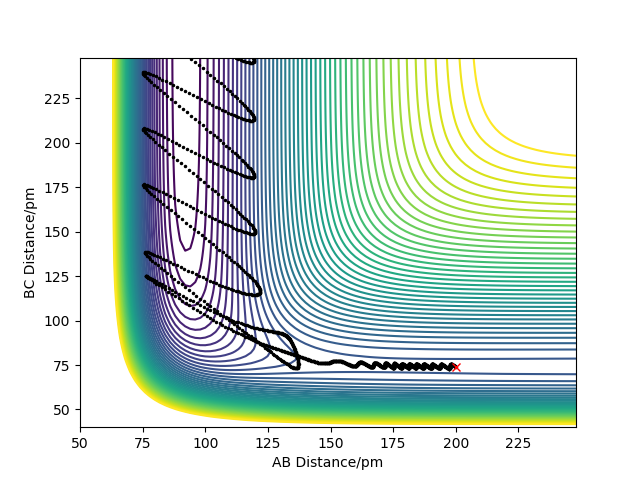
| 21:41, 22 May 2020 | ZN 01510257 Q10 Figure 6 1.png (file) |  |
187 KB | The 6th contour plot in the table | 1 |
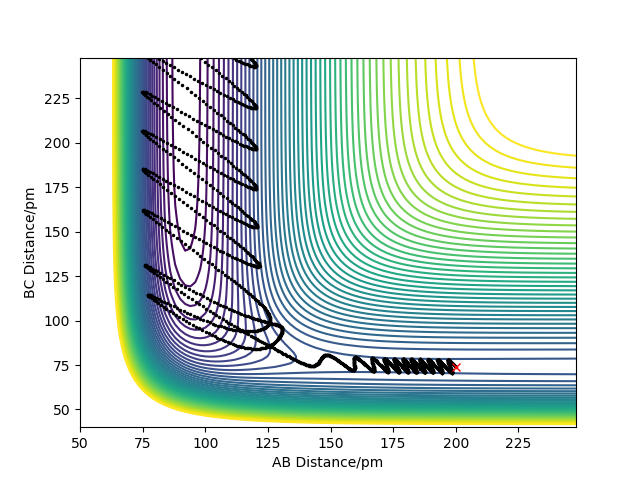
| 21:40, 22 May 2020 | ZN 01510257 Q10 Figure 5 1.png (file) |  |
208 KB | The fifth contour plot in the table | 1 |
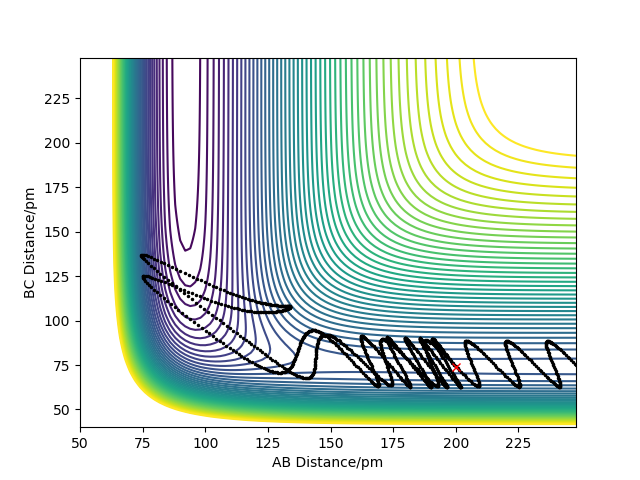
| 21:40, 22 May 2020 | ZN 01510257 Q10 Figure 4 1.png (file) |  |
197 KB | The 4th contour plot in the table | 1 |
| 21:39, 22 May 2020 | ZN 01510257 Q10 Figure 3 1.png (file) |  |
201 KB | The third contour plot in the table | 1 |
| 21:38, 22 May 2020 | ZN 01510257 Q10 Figure 2 1.png (file) |  |
197 KB | The second contour plot in the table | 1 |
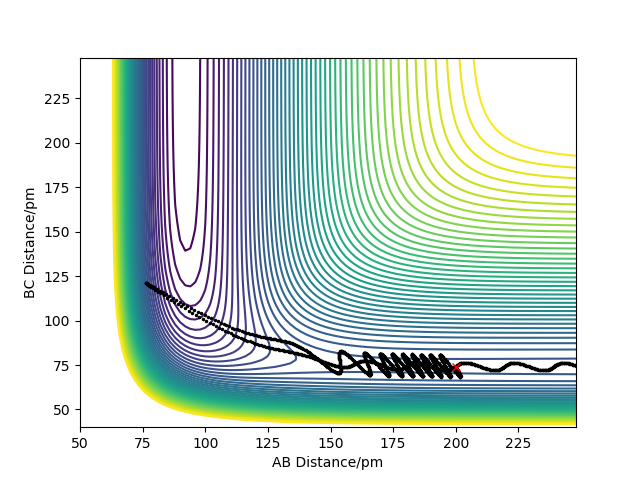
| 21:37, 22 May 2020 | ZN 01510257 Q10 Figure 1 1.png (file) |  |
193 KB | The first contour plot in the table | 1 |
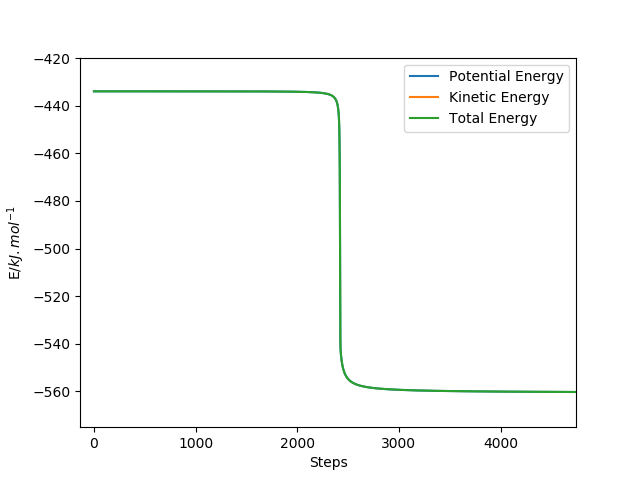
| 21:13, 22 May 2020 | ZN 01510257 Q8 Figure 2 2.png (file) |  |
28 KB | Energy vs time plot of 2nd situation zoomed in | 1 |
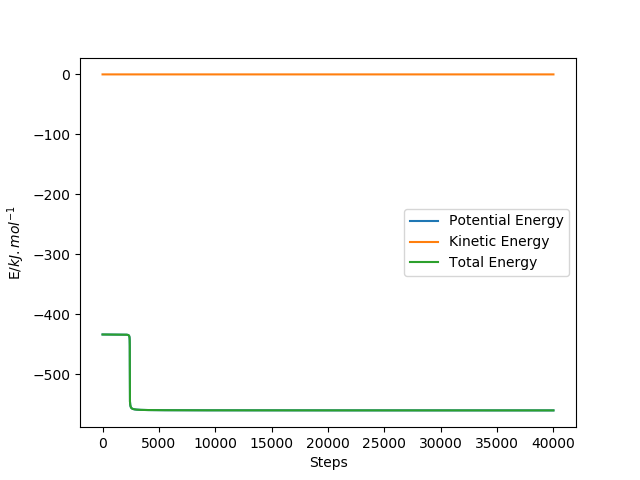
| 21:10, 22 May 2020 | ZN 01510257 Q8 Figure 2 1.png (file) |  |
18 KB | Energy vs time plot for 2nd situation | 2 |
| 21:09, 22 May 2020 | ZN 01510257 Q8 Figure 1 2.png (file) |  |
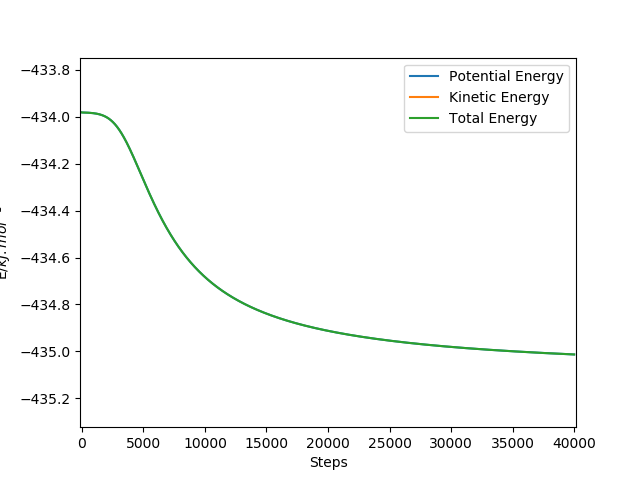
23 KB | Energy vs time plot zoomed in for first situation | 1 |
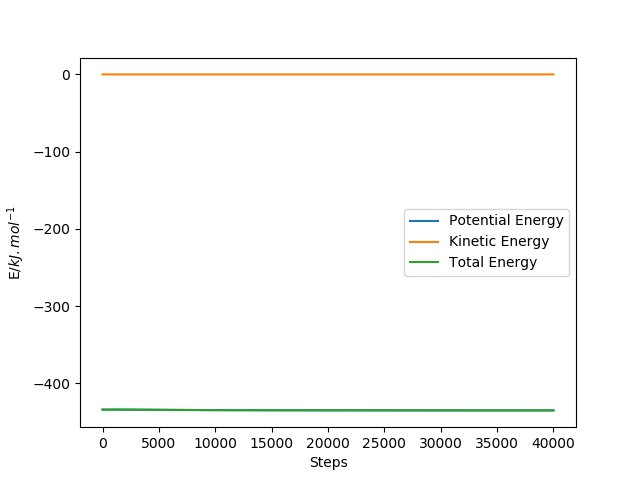
| 21:08, 22 May 2020 | ZN 01510257 Q8 Figure 1 1.png (file) |  |
19 KB | Energy vs time plot for the first system. | 1 |
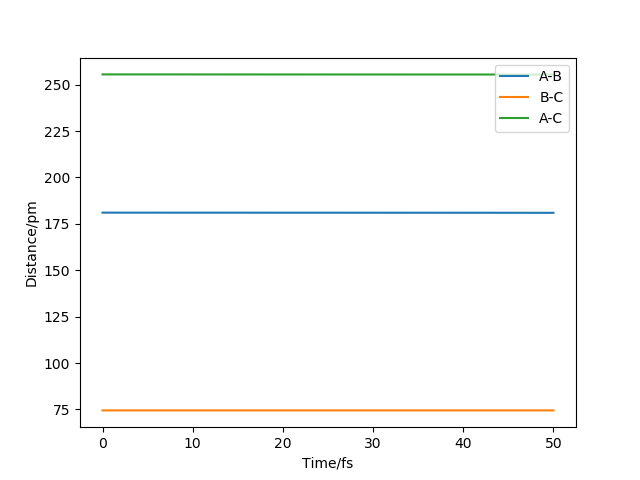
| 20:36, 22 May 2020 | ZN 01510257 Q7 Figure 4.png (file) |  |
15 KB | Internuclear distance vs time plot of final approximation of the TS | 1 |
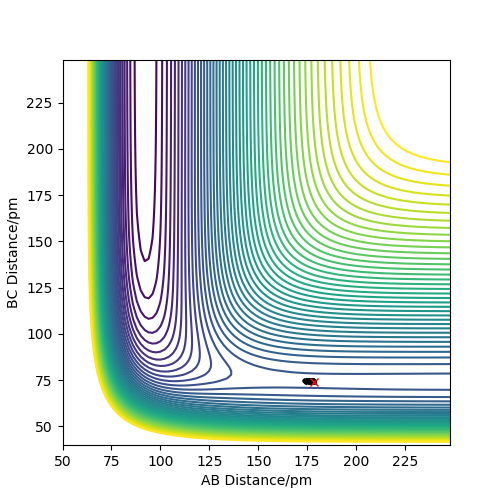
| 20:35, 22 May 2020 | ZN 01510257 Q7 Figure 3.png (file) |  |
183 KB | Final approximation for the TS for a FH + H system by ZN | 1 |
| 20:26, 22 May 2020 | ZN 01510257 Q7 Figure 2.png (file) |  |
162 KB | Second approximation for the transition state position. | 1 |
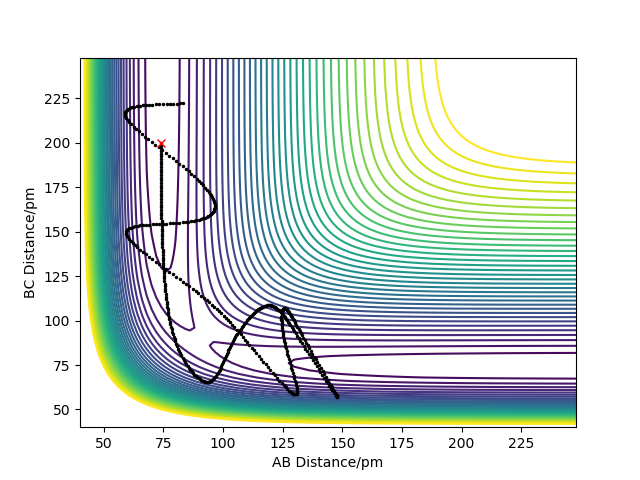
| 20:21, 22 May 2020 | ZN 01510257 Q7 Figure 1.png (file) |  |
163 KB | Dynamic calculation of first approximation of the HF + H TS. | 1 |
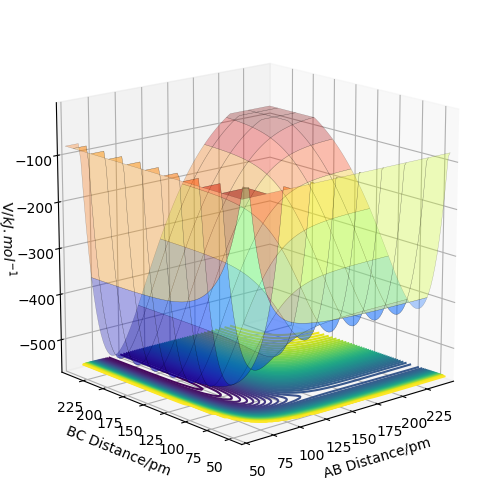
| 19:53, 22 May 2020 | ZN 01510257 Q6 Figure 1.png (file) |  |
130 KB | PES of FH + H system | 2 |
| 18:52, 22 May 2020 | ZN 01510257 Q3 Figure 5.png (file) |  |
178 KB | Dynamic calculated trajectory of the H2 + H system when displaced about r2 from TS. | 1 |
| 18:31, 22 May 2020 | ZN 01510257 Q3 Figure 4.png (file) |  |
177 KB | Reversed dynamic calculation of the H2 + H system slightly displaced from the TS. | 1 |
| 18:30, 22 May 2020 | ZN 01510257 Q4 Figure 4.png (file) |  |
183 KB | Reverted to version as of 09:31, 20 May 2020 | 3 |
| 18:19, 22 May 2020 | ZN 01510257 Q3 Figure 3.png (file) |  |
19 KB | mep calculated energy vs time graph of H2+H reaction | 1 |
| 18:06, 22 May 2020 | ZN 01510257 Q3 Figure 2.png (file) |  |
157 KB | Dynamic trajectory of H2 + H reaction slightly displaced from the transition state. | 1 |
| 18:02, 22 May 2020 | ZN 01510257 Q3 Figure 1.png (file) |  |
177 KB | mep trajectory for H2 + H when the r1 distance is increased by 1 pm. | 1 |
| 17:24, 22 May 2020 | ZN 01510257 Q2 Figure 3.png (file) |  |
13 KB | Internuclear distance vs time graph for H2 + H system at transition state. | 1 |
| 17:15, 22 May 2020 | ZN 01510257 Q2 Figure 2.png (file) |  |
20 KB | Internuclear distance vs time plot at AB=BC=90 pm, no momenta in system. | 1 |
| 17:05, 22 May 2020 | ZN 01510257 Q2 Figure 1.png (file) |  |
35 KB | Inter-nuclear distance vs time plot of H2 + H system. AB+C system | 1 |
| 15:52, 22 May 2020 | ZN 01510257 Q1 Figure 2.png (file) |  |
7 KB | The determinant of the hessian matrix | 1 |
| 15:29, 22 May 2020 | ZN 01510257 Q1 Figure 1.png (file) |  |
123 KB | Saddle point | 1 |
| 11:58, 21 May 2020 | Test2 5.png (file) |  |
60 KB | testtt | 2 |
| 09:32, 20 May 2020 | ZN 01510257 Q4 Figure 5.png (file) |  |
182 KB | Surface plot of the 5th trajectory as shown in the table. | 1 |
| 09:29, 20 May 2020 | ZN 01510257 Q4 Figure 3.png (file) |  |
179 KB | Surface plot of the 3rd trajectory stated in the table. | 1 |
| 09:26, 20 May 2020 | ZN 01510257 Q4 Figure 2.png (file) |  |
180 KB | Surface plot of the seconds stated trajectory showin in table. | 1 |
| 20:32, 19 May 2020 | ZN 01510257 Q4 Figure 1.png (file) |  |
179 KB | Trajectory shown via a surface plot of the 1st set of conditions shown in the table. | 1 |
| 13:14, 15 March 2019 | Zn4318 n2 bondlength lit.pdf (file) | 1.45 MB | 1 | ||
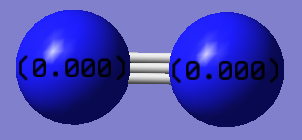
| 12:22, 15 March 2019 | Zn4318 n2 charge cam.png (file) |  |
20 KB | 1 | |
| 12:16, 15 March 2019 | ZN4318 N2 OPTIN POP CAM.LOG (file) | 196 KB | 1 | ||
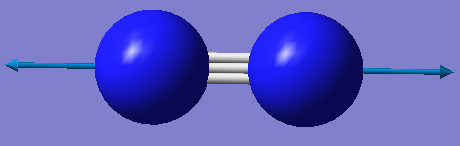
| 12:16, 15 March 2019 | Zn4318 n2 f1 cam.png (file) |  |
18 KB | 1 | |
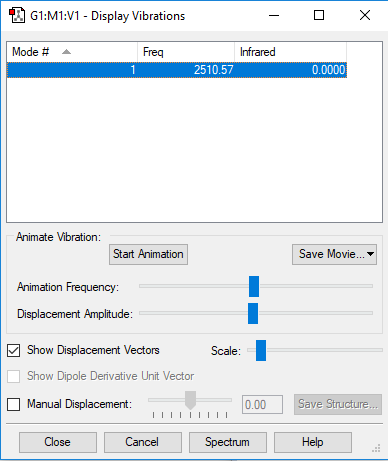
| 12:15, 15 March 2019 | Zn4318 n2 displayvib cam.png (file) |  |
12 KB | 1 | |
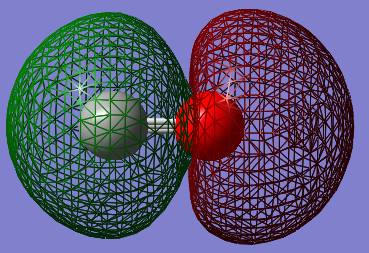
| 10:18, 15 March 2019 | Zn4318 co mo 4.png (file) |  |
130 KB | 1 | |
| 10:18, 15 March 2019 | Zn4318 co mo 5.png (file) |  |
137 KB | 1 | |
| 10:18, 15 March 2019 | Zn4318 co mo 6.png (file) |  |
138 KB | 1 |