
Uploads by Yqc18
This special page shows all uploaded files.
| Date | Name | Thumbnail | Size | Description | Versions |
|---|---|---|---|---|---|
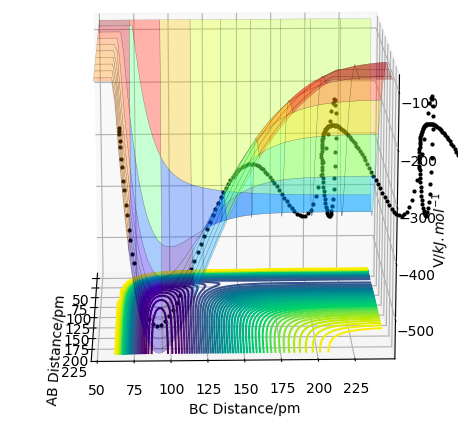
| 20:10, 22 May 2020 | Q10 low translation, high vibration surface plot 01506162.png (file) | 177 KB | 1 | ||
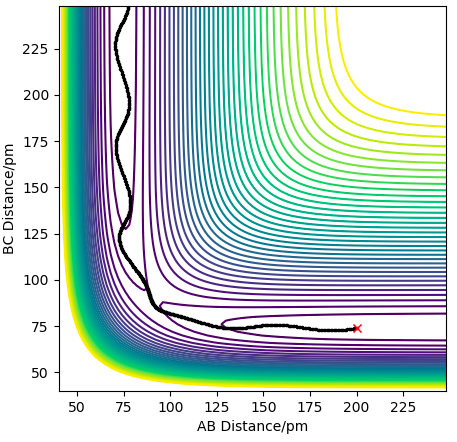
| 20:05, 22 May 2020 | Q10 low translation, high vibration contour 01506162.png (file) | 199 KB | 1 | ||
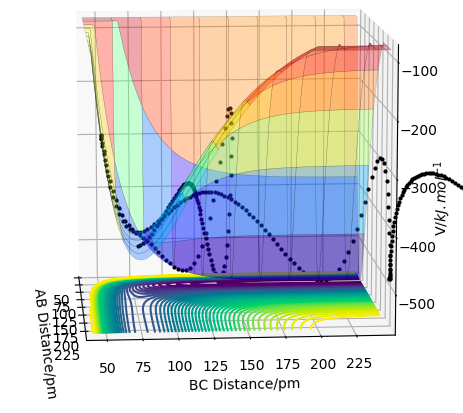
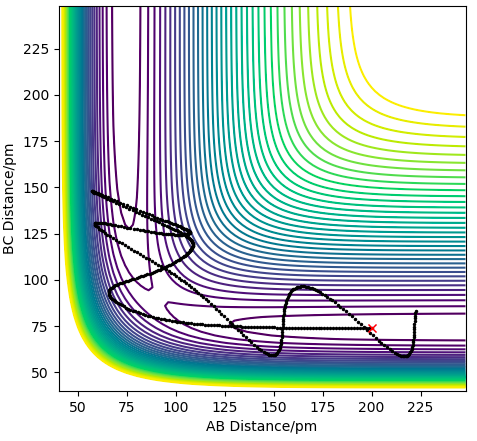
| 20:04, 22 May 2020 | Q10 high translation, low vibration contour 01506162.png (file) | 210 KB | 1 | ||
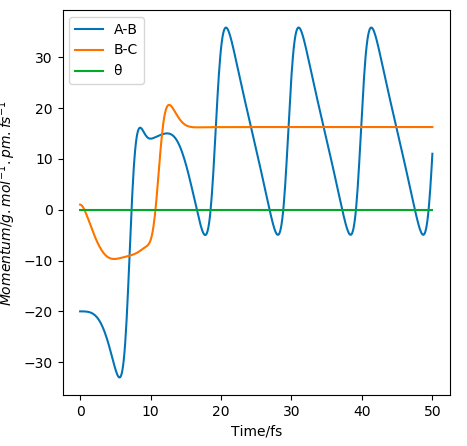
| 19:50, 22 May 2020 | Momentum vs time as proof of release of reaction energy 01506162.png (file) |  |
46 KB | 1 | |
| 19:25, 22 May 2020 | SM pre max energy 01506162.png (file) |  |
60 KB | 1 | |
| 17:47, 22 May 2020 | TS energy 01506162.png (file) |  |
62 KB | 1 | |
| 17:46, 22 May 2020 | P pro max energy 01506162.png (file) |  |
61 KB | 1 | |
| 17:46, 22 May 2020 | P max energy 01506162.png (file) |  |
60 KB | 1 | |
| 17:45, 22 May 2020 | P pre max energy 01506162.png (file) |  |
61 KB | 1 | |
| 17:45, 22 May 2020 | SM pro max energy 01506162.png (file) |  |
60 KB | 2 | |
| 17:44, 22 May 2020 | SM max energy 01506162.png (file) |  |
61 KB | 1 | |
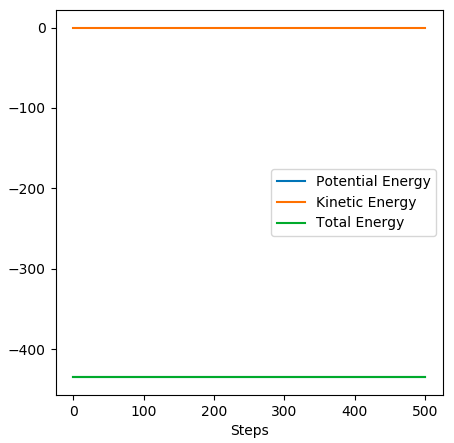
| 17:44, 22 May 2020 | SM energy plot 01506162.png (file) |  |
23 KB | 1 | |
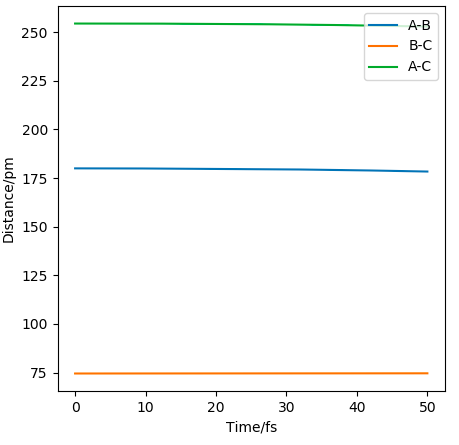
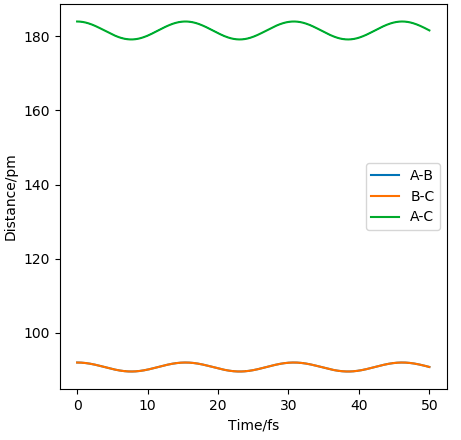
| 17:26, 22 May 2020 | Ex. 2 AB=180 pm, BC=74.49 pm distance vs time.png (file) |  |
26 KB | 1 | |
| 17:18, 22 May 2020 | Ex. 2 transition state distance vs time 01506162.png (file) | 24 KB | 1 | ||
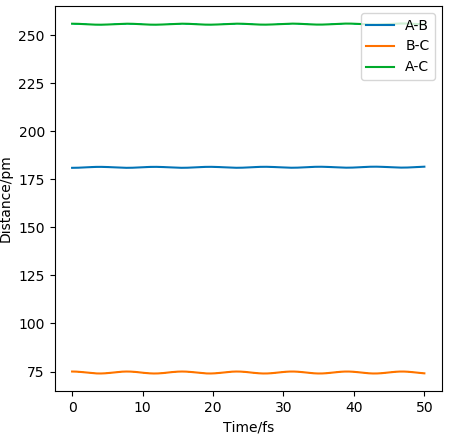
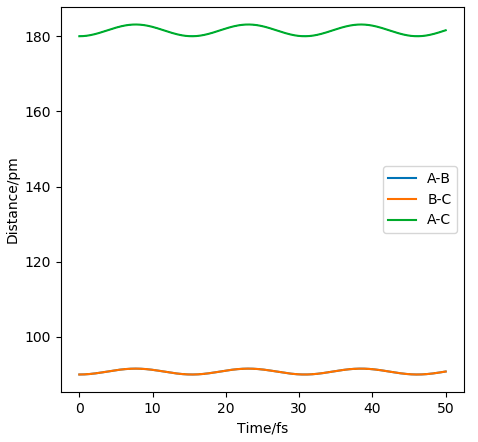
| 17:15, 22 May 2020 | Ex. 2 AB=181 pm, B=75 pm distance vs time 01506162.png (file) |  |
28 KB | 1 | |
| 17:14, 22 May 2020 | Q8 TS zero energy 01506162.png (file) |  |
62 KB | 1 | |
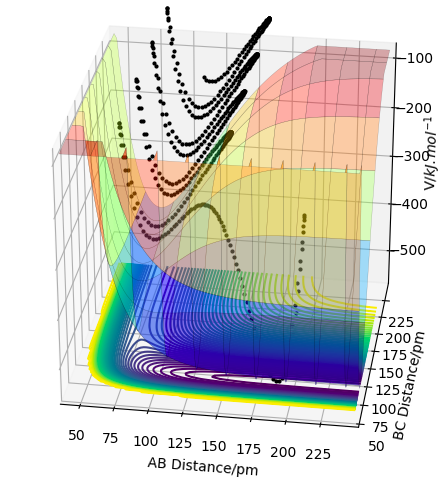
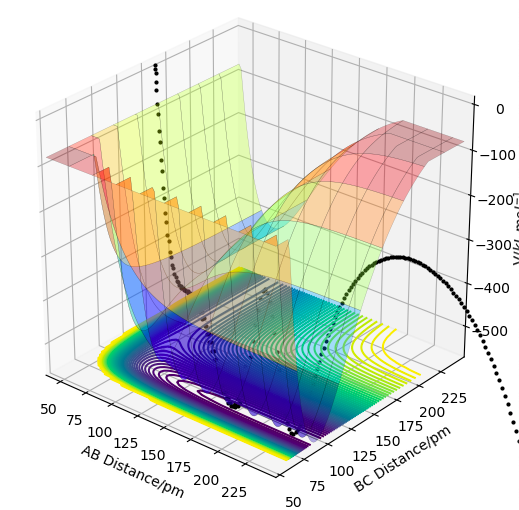
| 17:02, 22 May 2020 | Q6 endothermic surface plot 01506162.png (file) |  |
129 KB | 1 | |
| 17:02, 22 May 2020 | Q6 exothermic surface plot 01506162.png (file) |  |
120 KB | 1 | |
| 16:19, 22 May 2020 | Q3 MEP plot 01506162.png (file) |  |
184 KB | 1 | |
| 16:19, 22 May 2020 | Q3 dynamics plot 01506162.png (file) |  |
184 KB | 1 | |
| 16:02, 22 May 2020 | Q2 92 pm 01506162.png (file) |  |
28 KB | 1 | |
| 16:02, 22 May 2020 | Q2 90 pm 01506162.png (file) |  |
28 KB | 1 | |
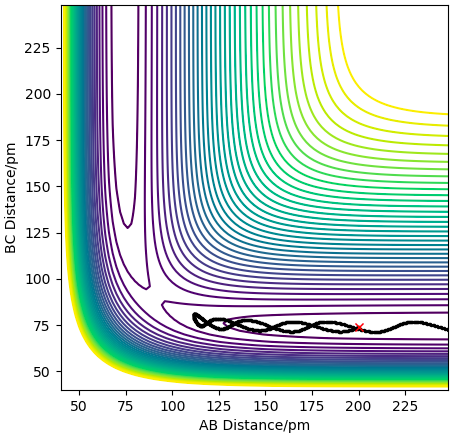
| 10:37, 21 May 2020 | Contour plot for second set yqc01506162.png (file) |  |
184 KB | 1 | |
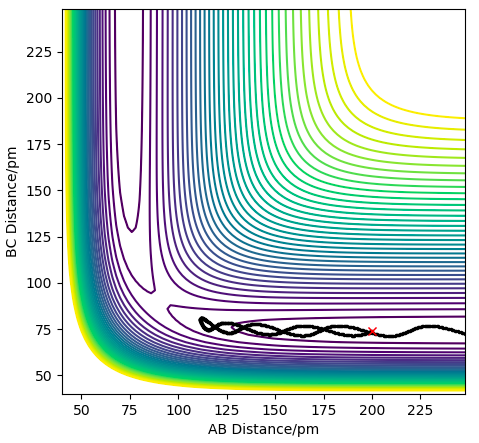
| 10:35, 21 May 2020 | Contour plot fot second set 01506162.png (file) |  |
189 KB | 1 | |
| 10:16, 21 May 2020 | Contour plot for fifth set.png (file) |  |
188 KB | 1 | |
| 10:16, 21 May 2020 | Contour plot for fourth set.png (file) |  |
192 KB | 1 | |
| 10:15, 21 May 2020 | Contour plot for third set.png (file) |  |
186 KB | 1 | |
| 10:15, 21 May 2020 | Contour plot fot second set.png (file) |  |
189 KB | 1 | |
| 10:14, 21 May 2020 | Contour plot for first set.png (file) |  |
191 KB | 1 | |
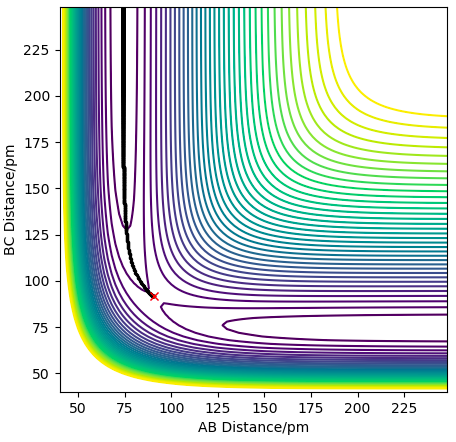
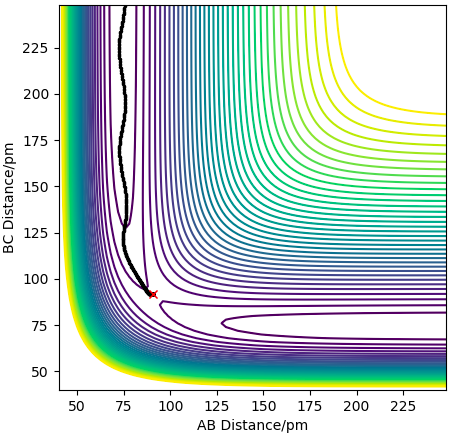
| 20:44, 19 May 2020 | Internuclear Distances vs Time for transition state 01506162.png (file) | 32 KB | 3 | ||
| 11:38, 22 March 2019 | COGBIK.png (file) |  |
5 KB | 1 | |
| 10:48, 22 March 2019 | HCN MO 9.png (file) |  |
14 KB | 1 | |
| 10:15, 22 March 2019 | HCN MO 8.png (file) |  |
21 KB | 1 | |
| 10:05, 22 March 2019 | HCN MO 2.png (file) |  |
16 KB | 1 | |
| 09:59, 22 March 2019 | HCN MO 1.png (file) |  |
11 KB | 1 | |
| 09:52, 22 March 2019 | HCN MO 6.png (file) |  |
18 KB | 1 | |
| 09:42, 22 March 2019 | HCN MO 5.png (file) |  |
15 KB | 1 | |
| 22:51, 21 March 2019 | NBO CL2.png (file) |  |
14 KB | 1 | |
| 22:50, 21 March 2019 | Cl2 vibration.png (file) |  |
11 KB | 2 | |
| 22:47, 21 March 2019 | Display vibration cl2.png (file) |  |
2 KB | 1 | |
| 22:43, 21 March 2019 | YQC CL2 OPTF POP.LOG (file) | 268 KB | 1 | ||
| 22:17, 21 March 2019 | NBO NH3.png (file) |  |
25 KB | 3 | |
| 22:13, 21 March 2019 | NBO HCN.png (file) |  |
12 KB | 1 | |
| 22:13, 21 March 2019 | NBO H2.png (file) |  |
19 KB | 1 | |
| 22:13, 21 March 2019 | NBO N2.png (file) |  |
22 KB | 1 | |
| 12:01, 21 March 2019 | HCN vibration 4.png (file) |  |
12 KB | 1 | |
| 12:01, 21 March 2019 | HCN vibration 3.png (file) |  |
14 KB | 1 | |
| 12:01, 21 March 2019 | HCN vibration 2.png (file) |  |
15 KB | 1 | |
| 12:01, 21 March 2019 | HCN vibration 1.png (file) |  |
16 KB | 1 | |
| 11:50, 21 March 2019 | Display vibration HCN.png (file) |  |
3 KB | 1 |