Jump to content
Main menu
Main menu
move to sidebar
hide
Navigation
Main Page
Chemistry Central
Blackboard
BB Labs
HPC + Publish
Data Publish Repository
Help
ChemWiki
Search
Search
Appearance
Log in
Personal tools
Log in
Uploads by Cas115
Help
English
Tools
Tools
move to sidebar
hide
Actions
General
User contributions
Logs
View user groups
Special pages
Printable version
Appearance
move to sidebar
hide
This special page shows all uploaded files.
File list
Items per page:
20
50
100
250
500
Username:
Include old versions of files
Show file list
First page
Previous page
Next page
Last page
Date
Name
Thumbnail
Size
Description
Versions
22:35, 24 October 2017
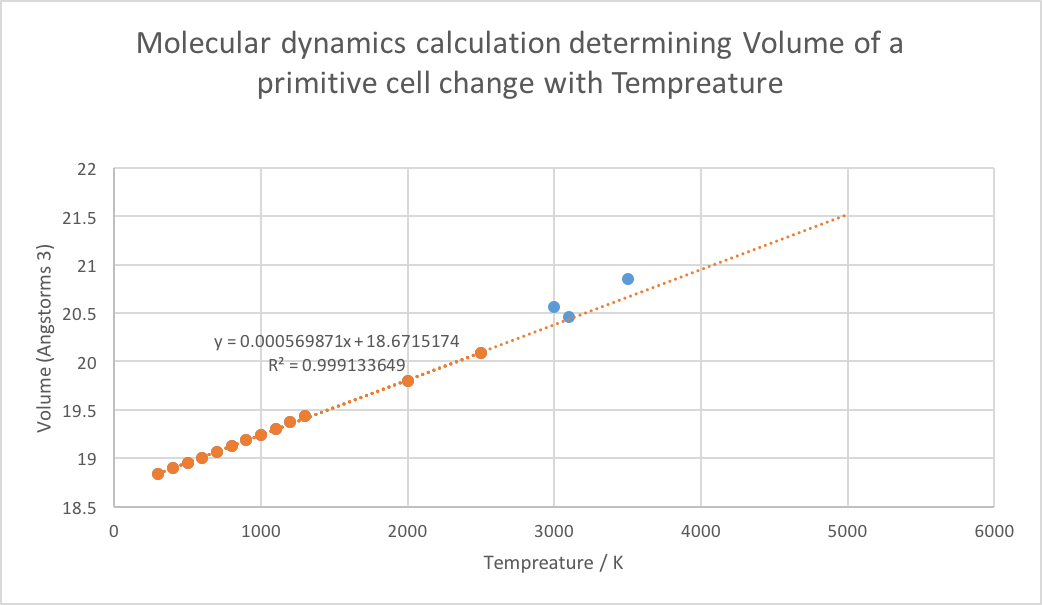
MD volume vs T.png
(
file
)
58 KB
1
22:32, 24 October 2017
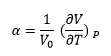
Thermal expansion large.PNG
(
file
)
1 KB
1
22:29, 24 October 2017
Thermal expansion incremental.PNG
(
file
)
1 KB
1
22:24, 24 October 2017
QHA Volume vs T.png
(
file
)
65 KB
1
22:21, 24 October 2017
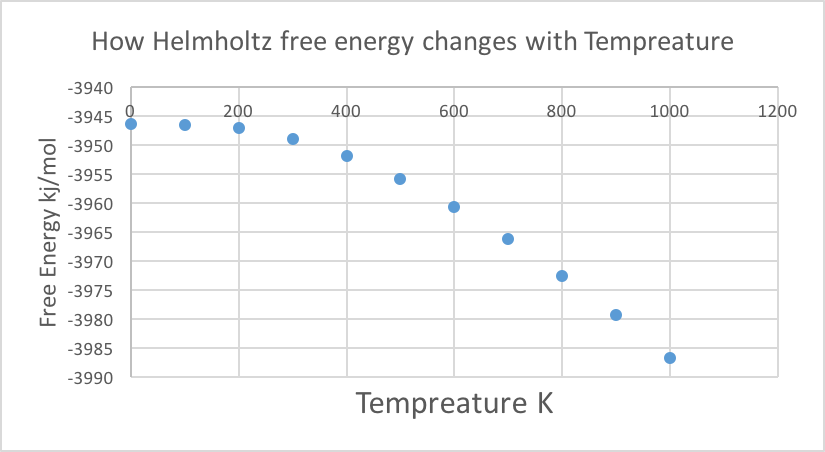
QHA Helm vs T.png
(
file
)
41 KB
1
22:04, 24 October 2017
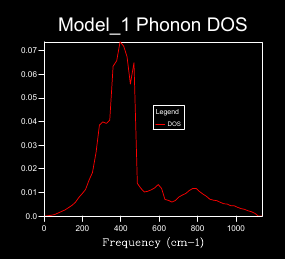
DOS 32.PNG
(
file
)
10 KB
2
21:57, 24 October 2017
DOS 24.PNG
(
file
)
18 KB
1
21:54, 24 October 2017
DOS 1.PNG
(
file
)
16 KB
1
21:49, 24 October 2017
Helmholtz QHA.PNG
(
file
)
3 KB
1
21:47, 24 October 2017
Disperison curve 3D Dia.PNG
(
file
)
15 KB
1
21:39, 24 October 2017
Disperison curve 1D Dia.PNG
(
file
)
29 KB
1
21:35, 24 October 2017
Disperison curve 1D Mono.PNG
(
file
)
5 KB
1
21:27, 24 October 2017
1 Relation bettween k and frequency.PNG
(
file
)
8 KB
1
21:17, 24 October 2017
Demonstrating 1D monatomic molecule.PNG
(
file
)
8 KB
1
21:04, 24 October 2017
Equation for k.PNG
(
file
)
669 bytes
1
15:41, 19 May 2017
H-H-H transitionstate pot energy cas115.PNG
(
file
)
43 KB
1
15:38, 19 May 2017
H-F-H transitionstate pot energy cas115.PNG
(
file
)
44 KB
1
15:32, 19 May 2017
Massive vib energy 2cas115.PNG
(
file
)
79 KB
1
15:00, 19 May 2017
Too high vib cas115.PNG
(
file
)
115 KB
1
14:21, 19 May 2017
Low vib energy 1cas115.PNG
(
file
)
119 KB
1
14:15, 19 May 2017
Massive vib energy 1cas115.PNG
(
file
)
75 KB
1
13:50, 19 May 2017
Change of high pot to vib cas115.PNG
(
file
)
106 KB
1
15:50, 9 May 2017
H-F-H transitionstate 2 full images cas115.PNG
(
file
)
40 KB
1
15:28, 9 May 2017
Activation energy full reactant energy cas115.png
(
file
)
40 KB
2
15:25, 9 May 2017
H-F-H transitionstate full images cas115.png
(
file
)
56 KB
3
14:44, 9 May 2017
H-F-H transitionstate bond distances cas115.png
(
file
)
46 KB
2
14:00, 9 May 2017
Activation energy zoom reactant energy cas115.png
(
file
)
42 KB
1
13:32, 9 May 2017
Transition state determination H2 cas115.png
(
file
)
104 KB
1
12:28, 9 May 2017
H-F-H transitionstate zoom cas115.png
(
file
)
73 KB
2
21:40, 8 May 2017
Hydrodgenflouride add hydrodgen reaction energy cas115.png
(
file
)
53 KB
1
21:20, 8 May 2017
Flourine add dihydrodgen reaction energy cas115.png
(
file
)
35 KB
1
18:50, 8 May 2017
Path5 reaction cas115.png
(
file
)
120 KB
1
18:32, 8 May 2017
Path4 reaction cas115.png
(
file
)
132 KB
1
18:11, 8 May 2017
Path3 reaction cas115.png
(
file
)
110 KB
1
17:54, 8 May 2017
Path2 reaction cas115.png
(
file
)
132 KB
1
17:42, 8 May 2017
Path1 reaction cas115.png
(
file
)
111 KB
1
16:01, 8 May 2017
MEP H2 cas115.png
(
file
)
86 KB
1
16:00, 8 May 2017
Molecular dynamics comparison to MEP cas115.png
(
file
)
86 KB
1
15:27, 8 May 2017
Transition state minima H2 cas115.png
(
file
)
40 KB
2
15:22, 4 March 2016
HCl molecule.png
(
file
)
43 KB
1
14:17, 4 March 2016
LOMO for Cl2.png
(
file
)
108 KB
1
14:17, 4 March 2016
HOMO for Cl2.png
(
file
)
104 KB
1
16:47, 2 March 2016
Cl2 MO s orbitals no overlap.png
(
file
)
50 KB
1
16:47, 2 March 2016
Cl2 MO sigma antibonding.png
(
file
)
75 KB
2
16:47, 2 March 2016
Cl2 sigma bonding.png
(
file
)
70 KB
2
16:46, 2 March 2016
Cl2 MO p orbital X orientation.png
(
file
)
52 KB
1
16:45, 2 March 2016
Cl2 MO p orbital Y orientation.png
(
file
)
50 KB
1
16:22, 2 March 2016
CL2 OPTIMISED.LOG
(
file
)
268 KB
1
16:15, 2 March 2016
CL2 optimised.chk
(
file
)
716 KB
1
15:44, 2 March 2016
CL2 MOs.gjf
(
file
)
287 bytes
1
First page
Previous page
Next page
Last page


