Jump to content
Main menu
Main menu
move to sidebar
hide
Navigation
Main Page
Chemistry Central
Blackboard
BB Labs
HPC + Publish
Data Publish Repository
Help
ChemWiki
Search
Search
Appearance
Log in
Personal tools
Log in
Uploads by Cah12
Help
English
Tools
Tools
move to sidebar
hide
Actions
General
User contributions
Logs
View user groups
Special pages
Printable version
Appearance
move to sidebar
hide
This special page shows all uploaded files.
File list
Items per page:
20
50
100
250
500
Username:
Include old versions of files
Show file list
First page
Previous page
Next page
Last page
Date
Name
Thumbnail
Size
Description
Versions
16:55, 10 March 2016
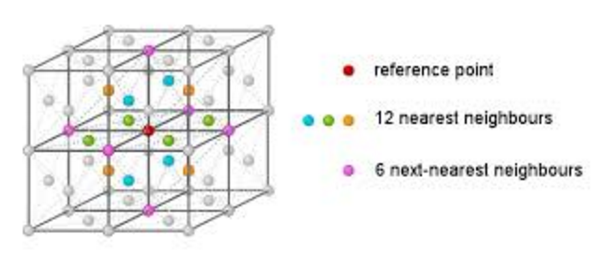
Fcc nearest neighbours.PNG
(
file
)
140 KB
1
16:49, 10 March 2016
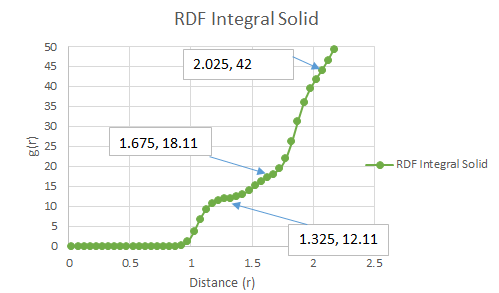
CahRunning integral solid labelled.PNG
(
file
)
12 KB
1
16:39, 10 March 2016
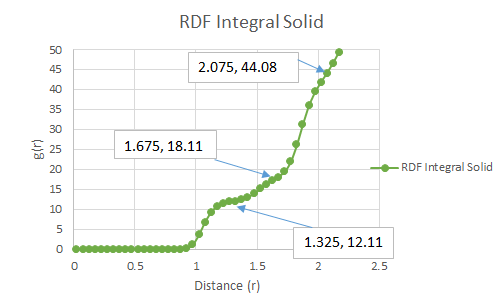
CHRunning integral solid labelled.PNG
(
file
)
12 KB
1
16:37, 10 March 2016
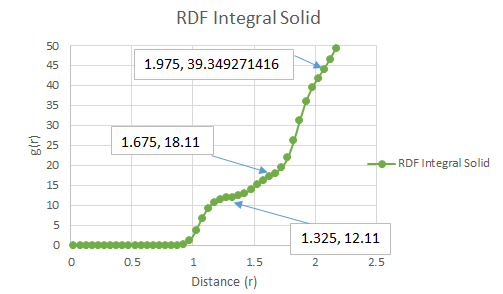
CAHRunning integral solid labelled.PNG
(
file
)
12 KB
1
14:41, 10 March 2016
CAHFcc labelled.PNG
(
file
)
54 KB
1
16:22, 9 March 2016
CAHVACF vs Time solid millions.PNG
(
file
)
20 KB
1
16:20, 9 March 2016
CAHRunning integral liquid millions.PNG
(
file
)
31 KB
1
16:19, 9 March 2016
CAHRunning intergal vapour millions.PNG
(
file
)
30 KB
1
16:17, 9 March 2016
CAHRunning integral solid millions.PNG
(
file
)
30 KB
1
16:17, 9 March 2016
CAHVACF vs Time liquid millions.PNG
(
file
)
24 KB
1
16:16, 9 March 2016
CAHVACF vs Time vapour millions.PNG
(
file
)
27 KB
1
16:15, 9 March 2016
CAHRunning integral solid.PNG
(
file
)
32 KB
1
16:14, 9 March 2016
CAHRunning integral liquid.PNG
(
file
)
36 KB
1
16:13, 9 March 2016
CAHRunning intergal vapour.PNG
(
file
)
30 KB
1
17:08, 8 March 2016
CAHVACF vs Time solid.PNG
(
file
)
8 KB
1
17:07, 8 March 2016
CAHVACF vs Time liquid.PNG
(
file
)
7 KB
1
17:06, 8 March 2016
CAHVACF vs Time.PNG
(
file
)
9 KB
1
16:47, 8 March 2016
CAHVelocity Autocorrelation Function vs timestep graph.PNG
(
file
)
24 KB
1
15:32, 8 March 2016
CAHMSD vs Time solid million atoms.PNG
(
file
)
9 KB
1
15:32, 8 March 2016
CAHMSD vs Time liquid million atoms.PNG
(
file
)
11 KB
1
15:32, 8 March 2016
CAHMSD vs Time vapour million atoms.PNG
(
file
)
12 KB
1
15:31, 8 March 2016
CAHMSD vs Time solid.PNG
(
file
)
11 KB
1
15:30, 8 March 2016
CAHMSD vs Time liquid.PNG
(
file
)
11 KB
1
15:30, 8 March 2016
CAHMSD vs Time vapour.PNG
(
file
)
11 KB
1
14:45, 8 March 2016
CAHMSD solid Million atoms.PNG
(
file
)
13 KB
1
14:44, 8 March 2016
CAHMSD liquid Million atoms.PNG
(
file
)
14 KB
1
14:44, 8 March 2016
CahMSD Vapour Million atoms.PNG
(
file
)
15 KB
1
14:16, 8 March 2016
CAHMSD Vapour timestep 1500.PNG
(
file
)
12 KB
1
14:15, 8 March 2016
CAHMSD Vapour timestep 1000.PNG
(
file
)
12 KB
1
14:15, 8 March 2016
CAHMSD Vapour timestep 500.PNG
(
file
)
13 KB
1
17:53, 7 March 2016
CahMSD Solid.PNG
(
file
)
16 KB
1
17:53, 7 March 2016
CahMSD liquid.PNG
(
file
)
15 KB
1
17:52, 7 March 2016
CahMSD Vapour.PNG
(
file
)
14 KB
1
17:04, 7 March 2016
CahRDF Solid integration Labelled.PNG
(
file
)
13 KB
1
16:52, 7 March 2016
CahRDF Solid Labelled.PNG
(
file
)
16 KB
1
16:32, 7 March 2016
CAHRDF simulation all 3 states graph.PNG
(
file
)
21 KB
1
16:31, 7 March 2016
CahRDF simulation solid integration graph.PNG
(
file
)
9 KB
1
16:30, 7 March 2016
CahRDF simulation Liquid integration graph.PNG
(
file
)
8 KB
1
16:30, 7 March 2016
CahRdf gofr vapour integral graph.PNG
(
file
)
9 KB
1
16:28, 7 March 2016
CahRDF simulation solid graph.PNG
(
file
)
14 KB
1
16:27, 7 March 2016
CahRDF simulation Liquid graph.PNG
(
file
)
10 KB
1
16:26, 7 March 2016
CahRdf gofr vapour graph.PNG
(
file
)
10 KB
1
12:59, 7 March 2016
CAHIsochoric heat capacity over volume vs T.PNG
(
file
)
12 KB
1
15:32, 4 March 2016
CAHD vs T for varying pressure.PNG
(
file
)
22 KB
1
12:22, 3 March 2016
CAHEnergy vs time for each different timestep zoom.PNG
(
file
)
31 KB
1
12:10, 3 March 2016
CAHEnergy vs time for each different timestep.PNG
(
file
)
36 KB
1
16:31, 1 March 2016
CahEnergy vs time for each different timestep.PNG
(
file
)
23 KB
1
15:53, 1 March 2016
CahPressure vs Time - Timestep 0.001 zoom.PNG
(
file
)
8 KB
1
15:52, 1 March 2016
CahTemperature vs Time - timestep 0.001 zoom.PNG
(
file
)
8 KB
1
15:51, 1 March 2016
CahEnergy vs Time - For 0.001 timestep zoom.PNG
(
file
)
8 KB
1
First page
Previous page
Next page
Last page


