Jump to content
Main menu
Main menu
move to sidebar
hide
Navigation
Main Page
Chemistry Central
Blackboard
BB Labs
HPC + Publish
Data Publish Repository
Help
ChemWiki
Search
Search
Appearance
Log in
Personal tools
Log in
Uploads by Am12618
Help
English
Tools
Tools
move to sidebar
hide
Actions
General
User contributions
Logs
View user groups
Special pages
Printable version
Appearance
move to sidebar
hide
This special page shows all uploaded files.
File list
Items per page:
20
50
100
250
500
Username:
Include old versions of files
Show file list
First page
Previous page
Next page
Last page
Date
Name
Thumbnail
Size
Description
Versions
20:29, 15 May 2020
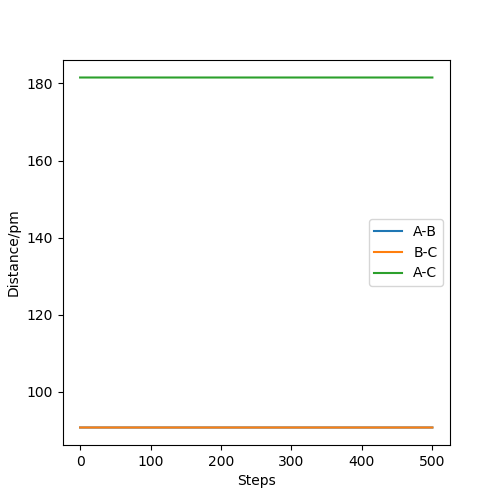
Internuclear distances vs Time plot of r1=r2=90.775 pm and p1=p2=0.png
(
file
)
13 KB
3
12:59, 15 May 2020
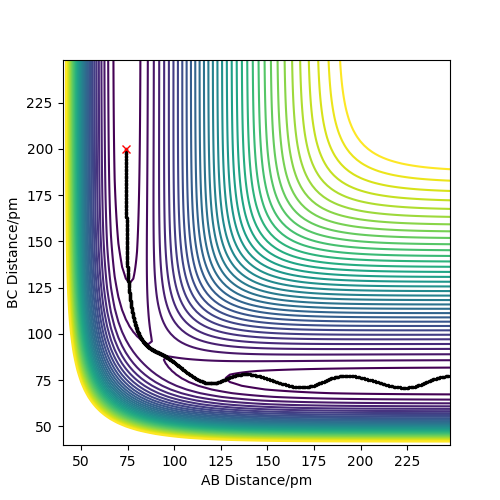
Reactive trajectory of an exothermic reaction.png
(
file
)
190 KB
1
12:49, 15 May 2020
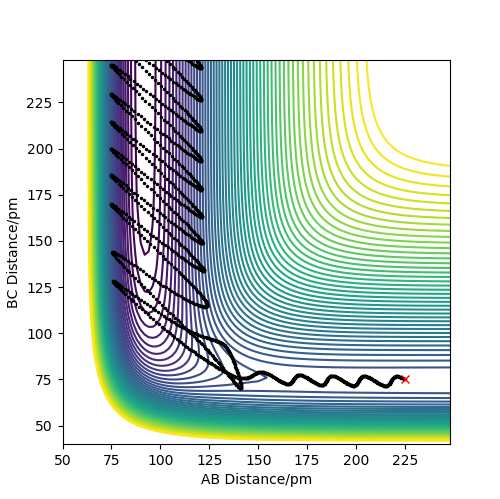
Exothermic Reaction Polyani's empirical Rules successful Reaction.png
(
file
)
179 KB
1
12:48, 15 May 2020
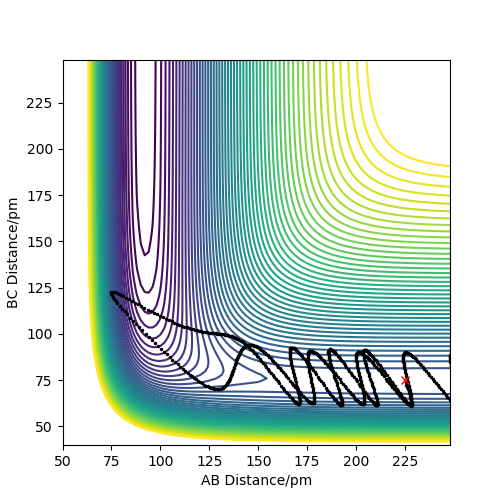
Exothermic Reaction Polyani's empirical Rules unsuccessful Reaction.png
(
file
)
176 KB
1
07:40, 15 May 2020
Momenta vs Time plot of H2 going to HF reactive trajectory with initial HH=75 HF=190, pHH=-5 and pHF=-1.png
(
file
)
44 KB
1
07:40, 15 May 2020
Contour plot of H2 going to HF reactive trajectory with initial HH=75 HF=190, pHH=-5 and pHF=-1.png
(
file
)
177 KB
1
07:01, 15 May 2020
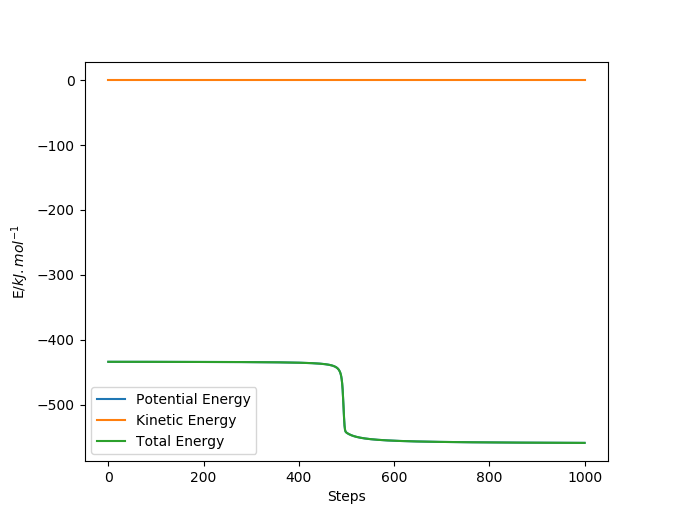
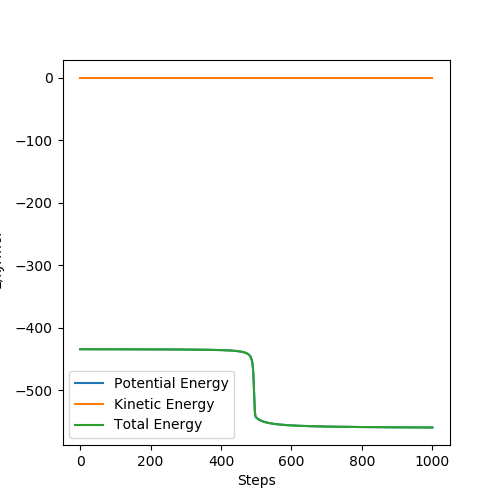
Energy vs time plot for exothermic reaction.png
(
file
)
26 KB
1
06:53, 15 May 2020
Plot5 Energy forms (170, 75, 0, 0, -544.341, -434.112).png
(
file
)
21 KB
1
06:50, 15 May 2020
Plot5 Energy HF forms (170, 75, 0, 0, -544.341, -434.112).png
(
file
)
19 KB
1
05:31, 15 May 2020
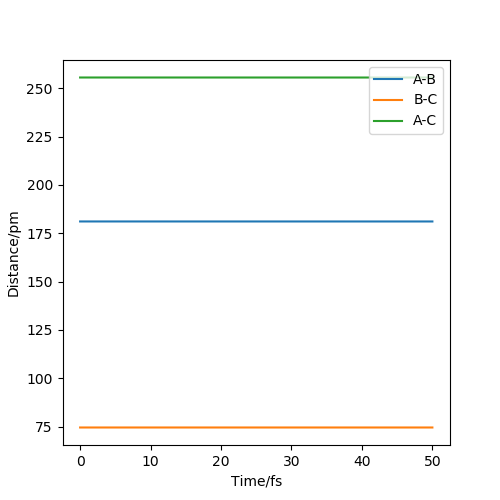
New Internuclear distances vs Time plot H-H-F system.png
(
file
)
14 KB
1
05:30, 15 May 2020
TS PES plot.png
(
file
)
109 KB
1
12:40, 14 May 2020
Internuclear distances vs Time plot H-H-F system.png
(
file
)
18 KB
1
12:39, 14 May 2020
Contour Plot of TS of F-H-H system.png
(
file
)
190 KB
1
12:20, 14 May 2020
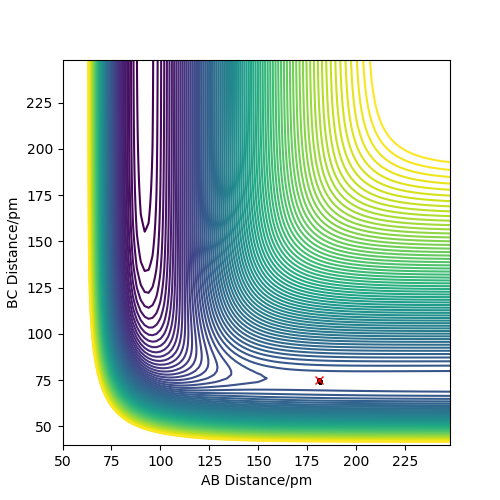
Contour Plot exercise 2 PES PART.png
(
file
)
168 KB
1
11:59, 14 May 2020
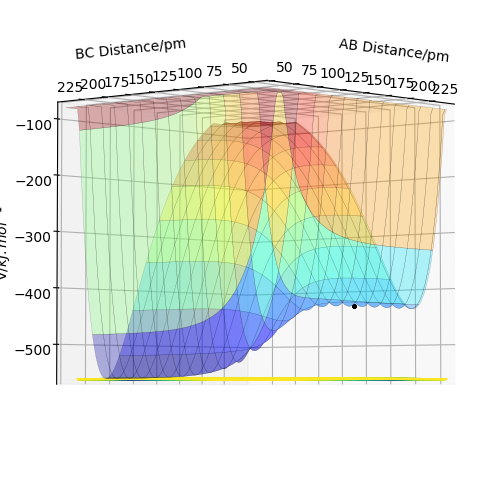
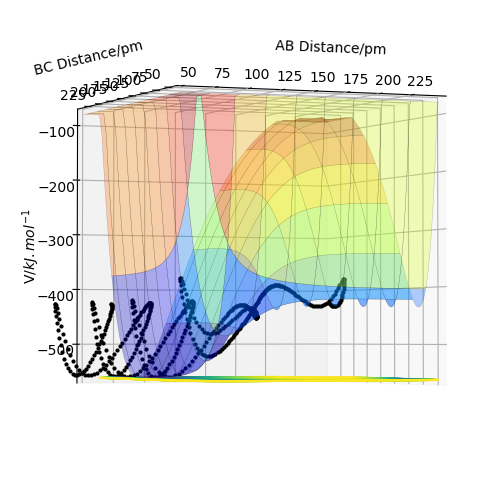
Surface Plot exercise 2 PES PART.png
(
file
)
97 KB
Surface plot with A= F, B=H, C=H
1
11:53, 14 May 2020
AM12618 5.png
(
file
)
161 KB
1
11:52, 14 May 2020
AM12618 4.png
(
file
)
162 KB
1
11:52, 14 May 2020
AM12618 3.png
(
file
)
159 KB
1
11:51, 14 May 2020
AM12618 2.png
(
file
)
160 KB
1
11:43, 14 May 2020
AM01564233 1.png
(
file
)
159 KB
1
21:04, 13 May 2020
Saddle point min and max.png
(
file
)
132 KB
1
16:00, 13 May 2020
AM Dynamics Calculation with r1 = rts+1 pm, r2 = rts and p1 = p2 = 0.png
(
file
)
27 KB
1
15:58, 13 May 2020
AM. MEP calculation with r1 = rts+1 pm, r2 = rts and p1 = p2 = 0.png
(
file
)
26 KB
1
15:30, 13 May 2020
Contour Plot of the best estimate of the transition state position(r1=r2=90.775 pm).png
(
file
)
157 KB
1
16:17, 15 March 2019
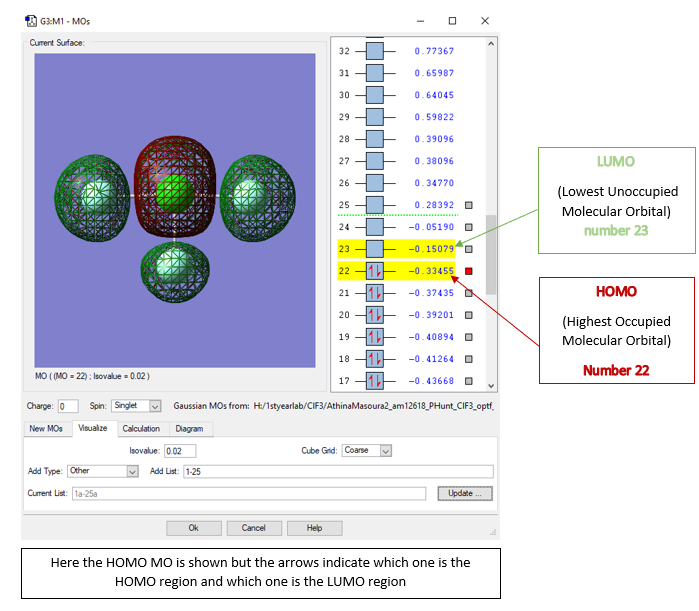
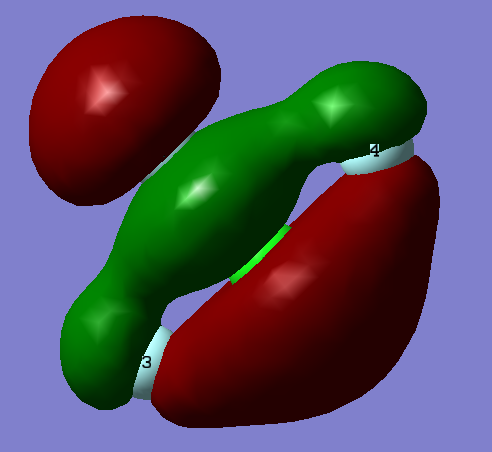
HOMO LUMO AM.PNG
(
file
)
144 KB
1
15:34, 15 March 2019
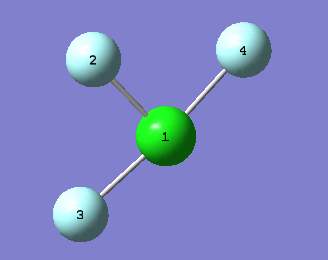
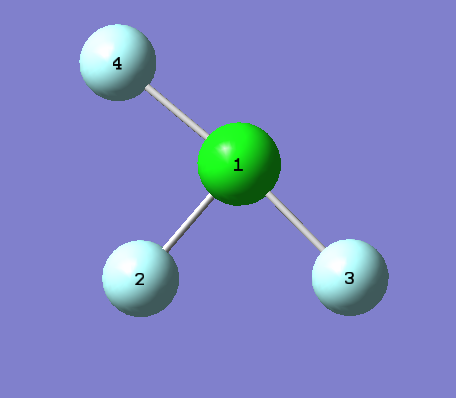
Molecule labels.PNG
(
file
)
22 KB
1
10:46, 15 March 2019
2AM MO 15.PNG
(
file
)
59 KB
1
10:46, 15 March 2019
2AM MO 13.PNG
(
file
)
71 KB
1
10:46, 15 March 2019
2AM MO 10.PNG
(
file
)
67 KB
1
10:45, 15 March 2019
2AM MO 9.PNG
(
file
)
58 KB
1
10:14, 15 March 2019
AM MO 15.PNG
(
file
)
73 KB
1
10:00, 15 March 2019
AM MO 13.PNG
(
file
)
84 KB
1
09:55, 15 March 2019
AM MO 10.PNG
(
file
)
64 KB
1
09:50, 15 March 2019
AM MO 9.PNG
(
file
)
74 KB
1
09:48, 15 March 2019
AM MO 1.PNG
(
file
)
34 KB
1
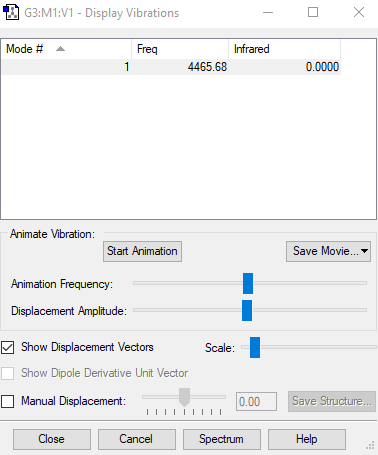
08:52, 15 March 2019
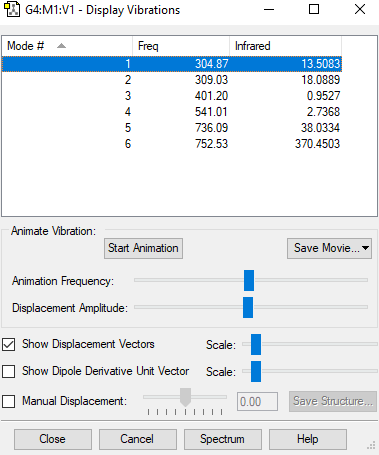
AM2 Display Vibrations ClF3.PNG
(
file
)
15 KB
1
08:51, 15 March 2019
AM2 Display Vibrations H2.PNG
(
file
)
13 KB
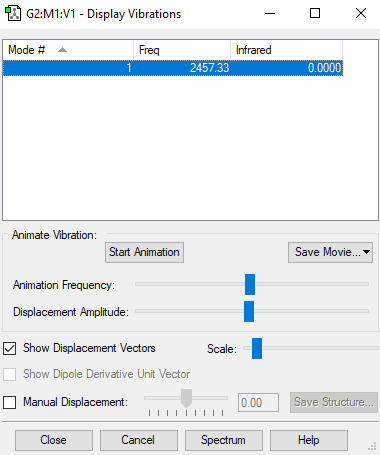
1
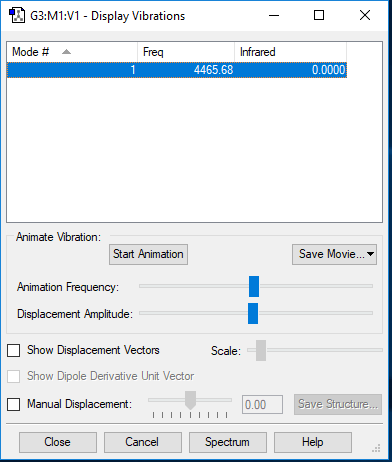
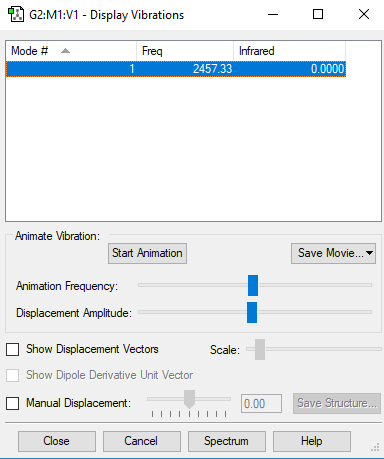
08:51, 15 March 2019
AM2 Display Vibrations N2.PNG
(
file
)
13 KB
1
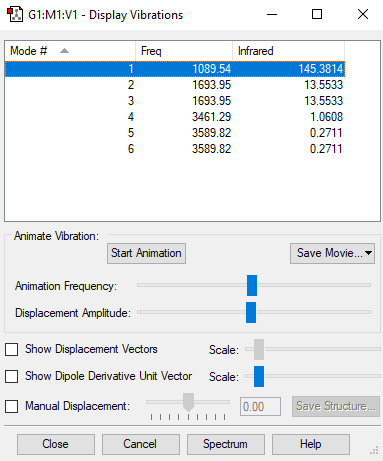
08:50, 15 March 2019
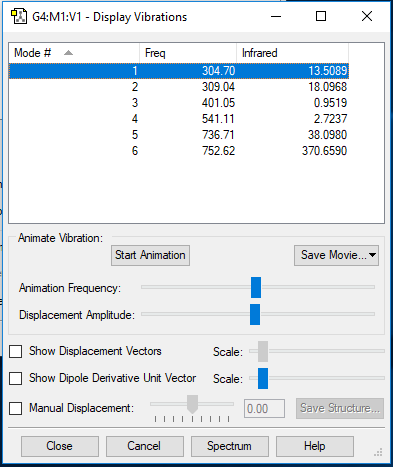
AM2 Display Vibrations NH3.PNG
(
file
)
15 KB
1
08:46, 15 March 2019
Charge distribution1.PNG
(
file
)
15 KB
1
08:45, 15 March 2019
2charge distribution H2.PNG
(
file
)
8 KB
1
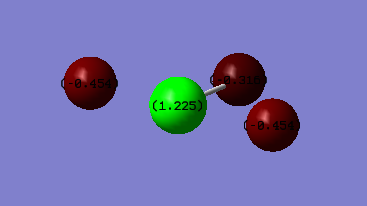
08:41, 15 March 2019
2Charge distribution on N2 molecule am.PNG
(
file
)
27 KB
Charge on nitrogen molecule
1
08:39, 15 March 2019
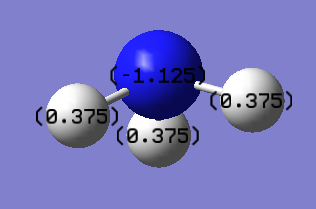
2Charge distribution on NH3 molecule am12618.PNG
(
file
)
24 KB
1
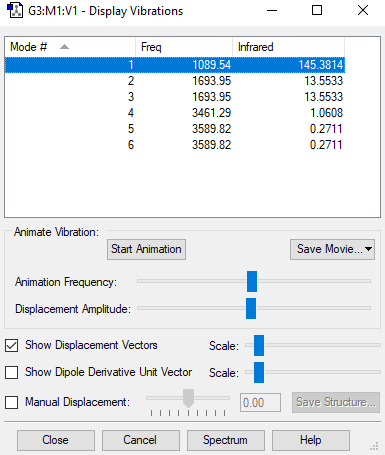
17:19, 14 March 2019
AM Display Vibrations ClF3.PNG
(
file
)
18 KB
1
17:17, 14 March 2019
AM Display Vibrations H2.PNG
(
file
)
16 KB
1
17:17, 14 March 2019
AM Display vibrations N2.PNG
(
file
)
13 KB
1
17:15, 14 March 2019
AM Display Vibrations NH3.PNG
(
file
)
15 KB
1
16:35, 14 March 2019
ATHINAMASOURA2 AM12618 PHUNT CLF3 OPTF POP.LOG
(
file
)
602 KB
1
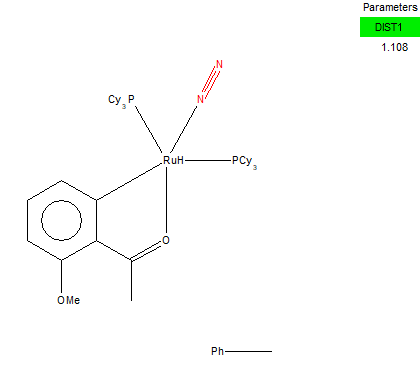
16:03, 14 March 2019
Transition Metal complex YECMOL withbonddistance.PNG
(
file
)
5 KB
1
15:41, 14 March 2019
AthinaMasoura am12618 PHunt h2 optf pop.LOG
(
file
)
95 KB
2
First page
Previous page
Next page
Last page


.png)
.png)


.png)