
Uploads by Ab9314
This special page shows all uploaded files.
| Date | Name | Thumbnail | Size | Description | Versions |
|---|---|---|---|---|---|
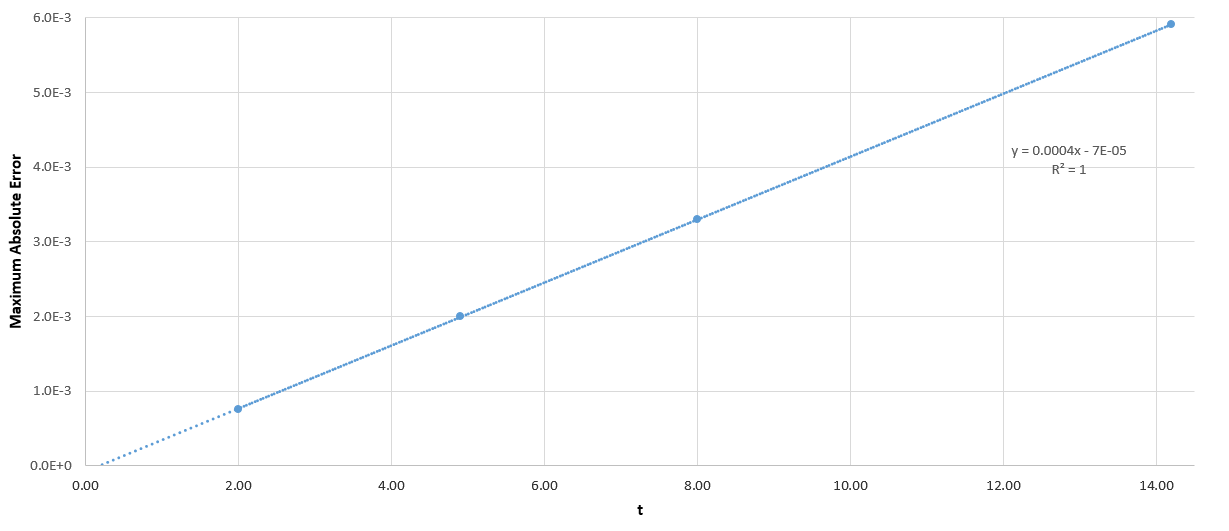
| 00:01, 24 March 2017 | Sho max error.PNG (file) |  |
30 KB | 1 | |
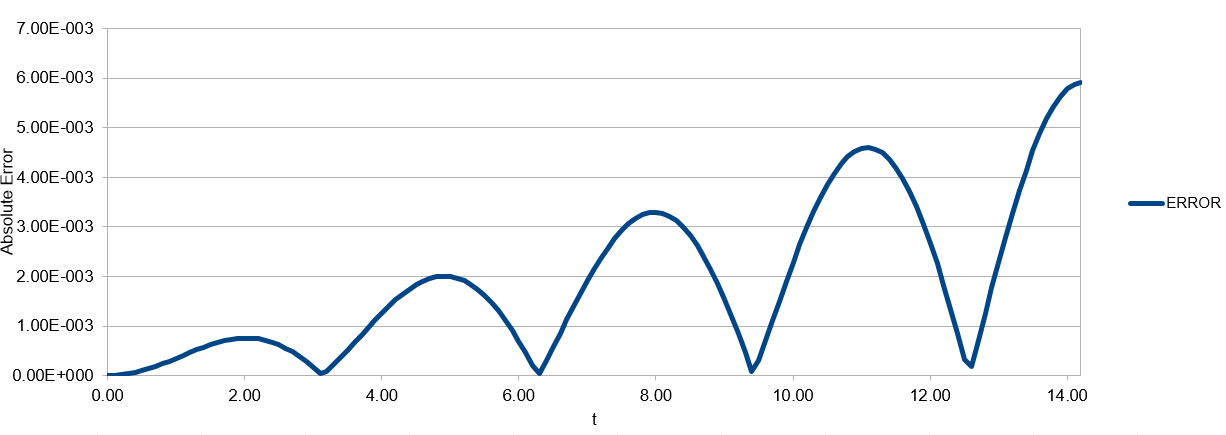
| 00:01, 24 March 2017 | Sho error.PNG (file) |  |
26 KB | 1 | |
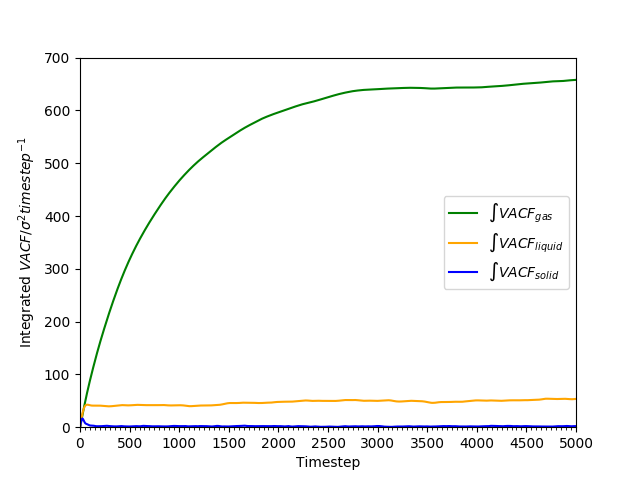
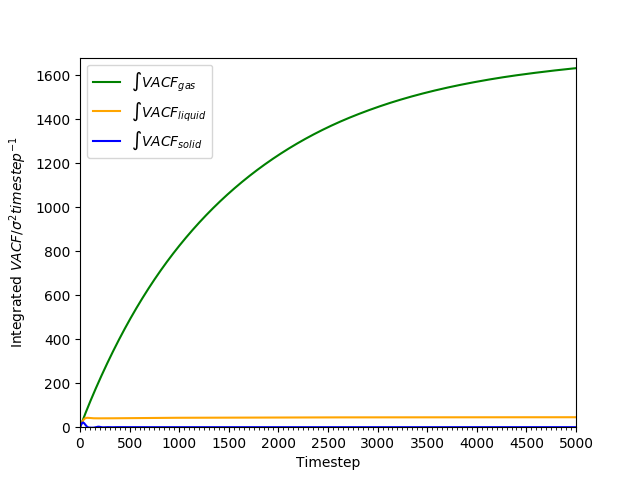
| 20:08, 23 March 2017 | Vacf trapz.png (file) |  |
33 KB | 2 | |
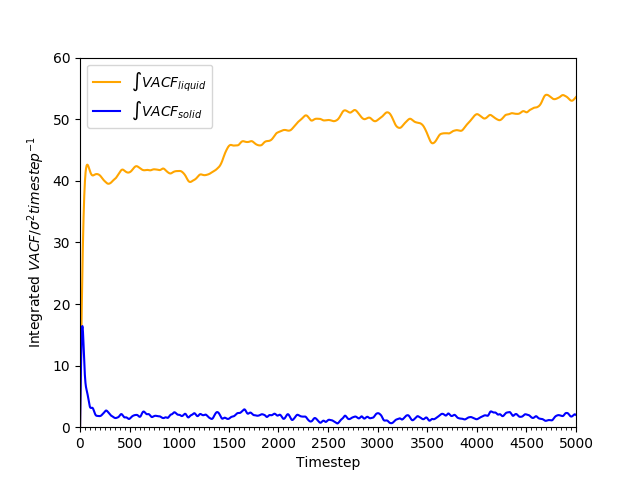
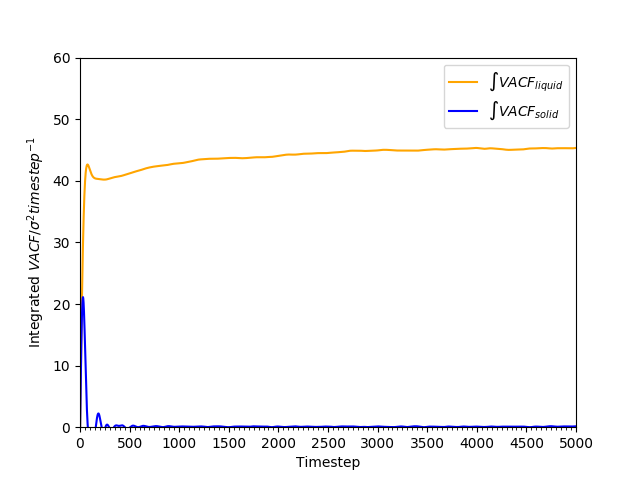
| 20:06, 23 March 2017 | Vacf trapz liq sol.png (file) |  |
32 KB | 2 | |
| 19:31, 23 March 2017 | Int vacf mill liq sol.png (file) |  |
25 KB | 1 | |
| 19:31, 23 March 2017 | Int vacf mill allStates.png (file) |  |
33 KB | 1 | |
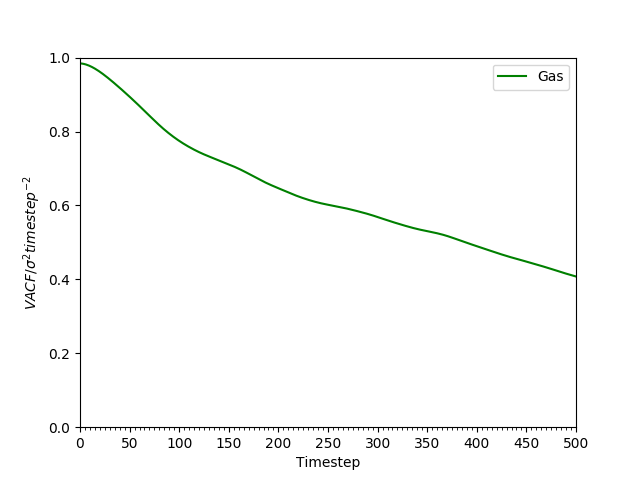
| 18:36, 23 March 2017 | Vacf gas.png (file) |  |
22 KB | 2 | |
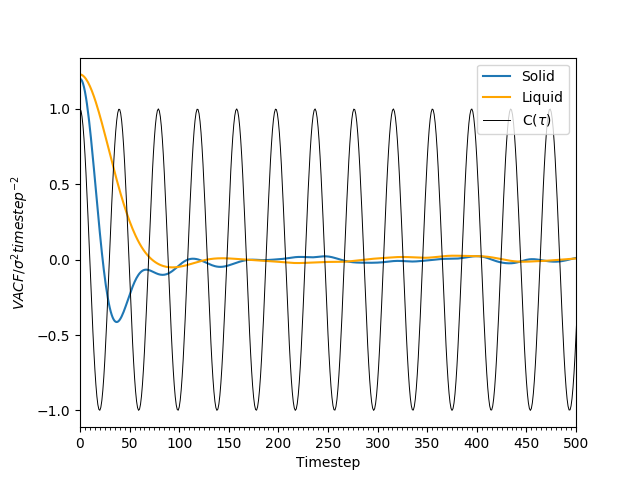
| 15:42, 23 March 2017 | Vacf allStates.png (file) |  |
48 KB | 1 | |
| 08:55, 23 March 2017 | Msd mill vap.png (file) |  |
27 KB | 1 | |
| 08:55, 23 March 2017 | Msd mill sol.png (file) |  |
28 KB | 1 | |
| 08:55, 23 March 2017 | Msd mill liq.png (file) |  |
26 KB | 1 | |
| 08:55, 23 March 2017 | Msd mill allStates.png (file) |  |
24 KB | 1 | |
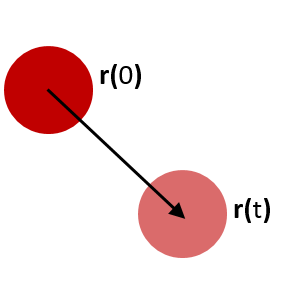
| 21:41, 22 March 2017 | MSD illustration.PNG (file) |  |
6 KB | 1 | |
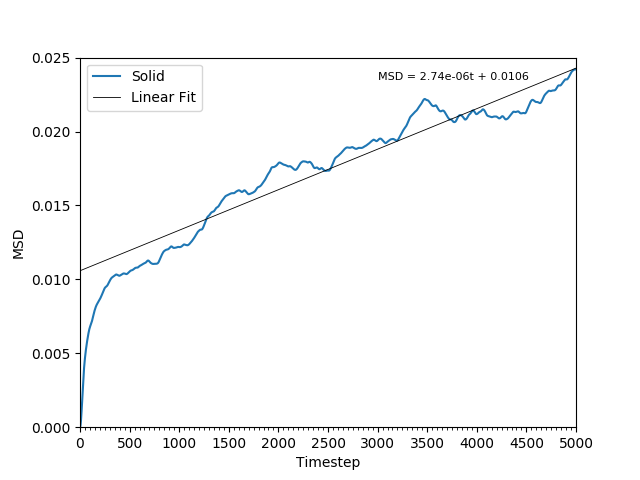
| 21:22, 22 March 2017 | Solid msd fitted.png (file) |  |
33 KB | 1 | |
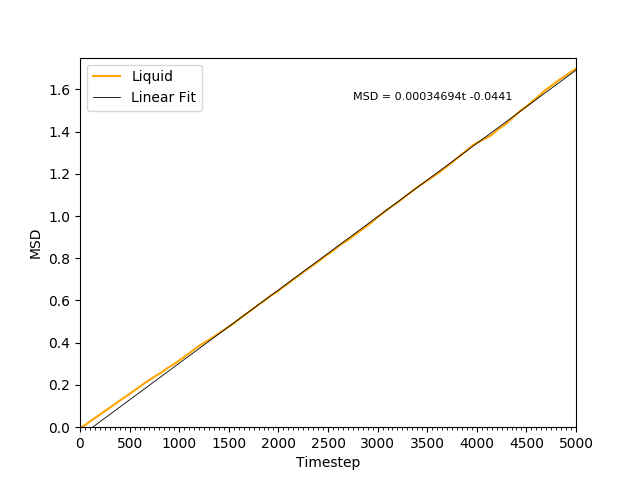
| 21:22, 22 March 2017 | Liquid msd fitted.png (file) |  |
27 KB | 1 | |
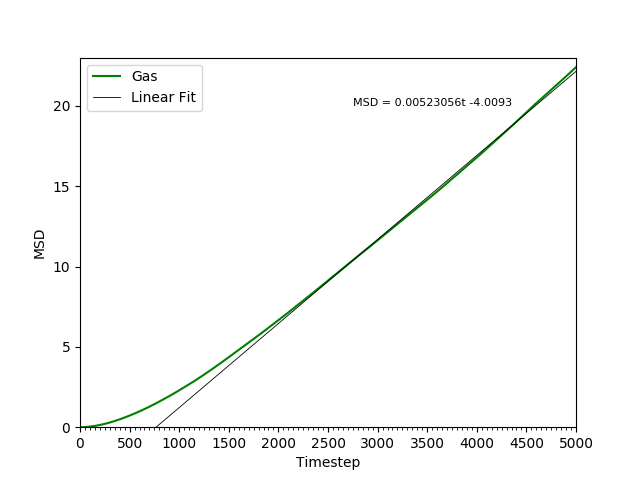
| 21:22, 22 March 2017 | Gas msd fitted.png (file) |  |
27 KB | 1 | |
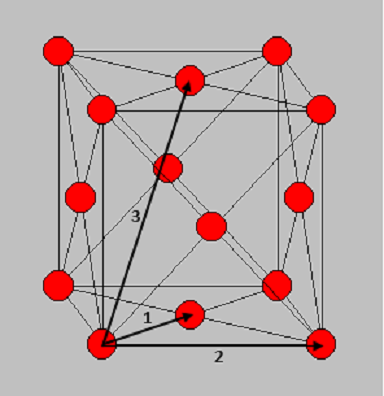
| 16:19, 17 March 2017 | Fcc lattice.png (file) |  |
35 KB | 1 | |
| 14:42, 17 March 2017 | AllStates MSD.png (file) |  |
34 KB | 1 | |
| 14:20, 17 March 2017 | Solid msd ab.png (file) |  |
23 KB | 1 | |
| 14:19, 17 March 2017 | Liq msd ab.png (file) |  |
21 KB | 1 | |
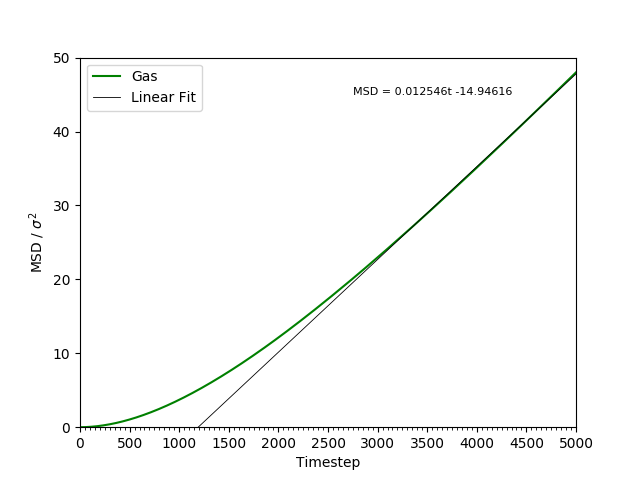
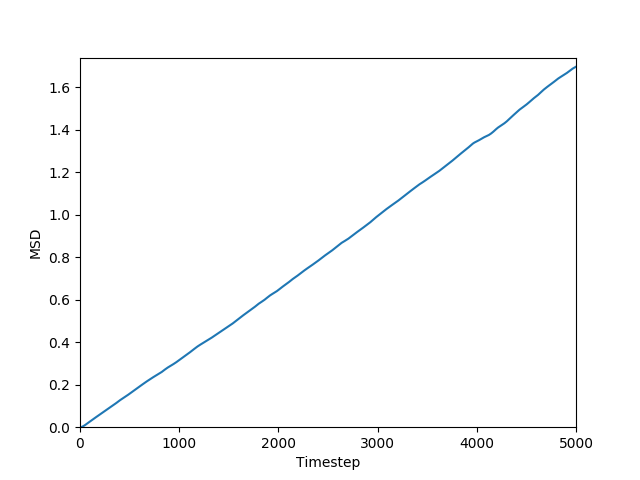
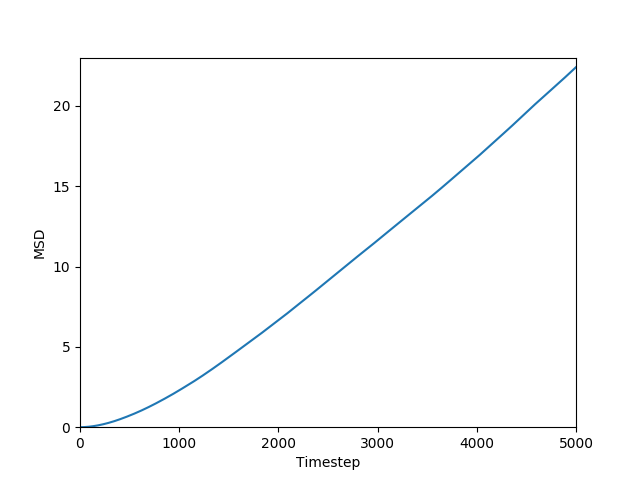
| 14:17, 17 March 2017 | Gas msd.png (file) |  |
18 KB | MSD for gas shows that at first, <math>MSD \propto t^2</math>, and then <math>MSD \propto t</math> at large values of <math>t</math>. | 8 |
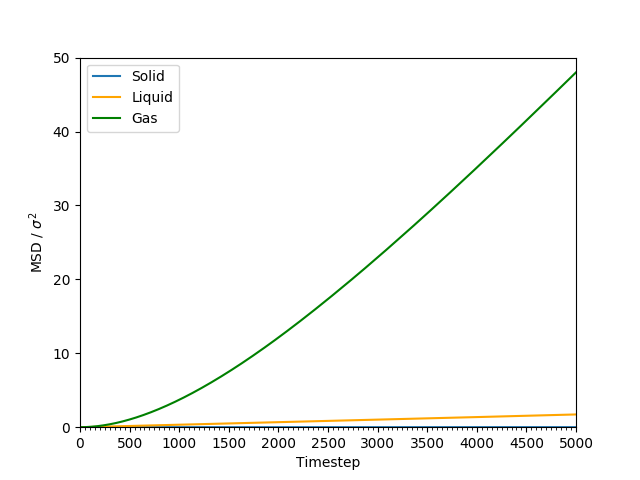
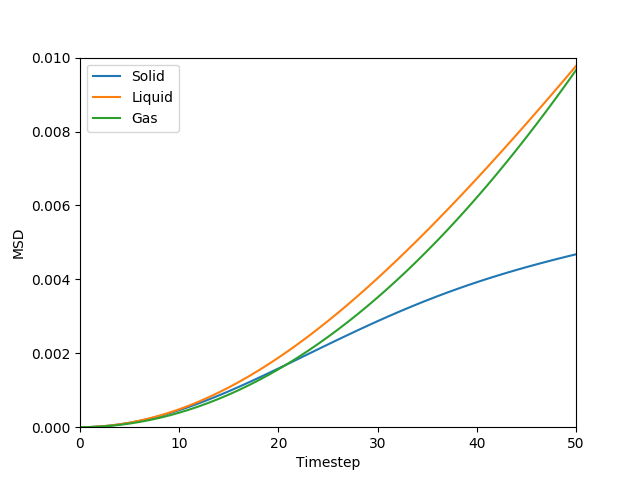
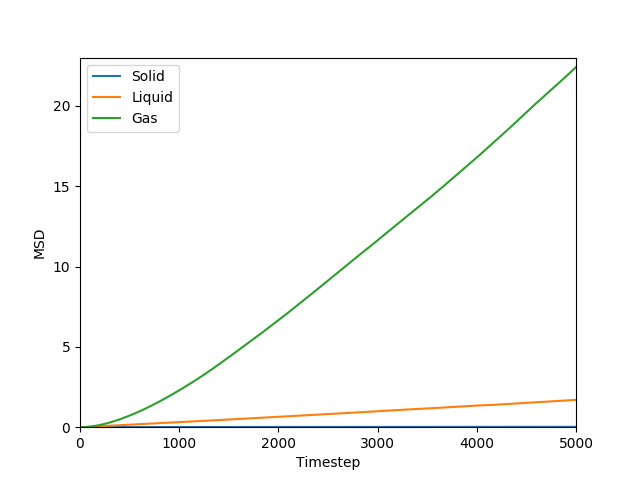
| 14:15, 17 March 2017 | AllStates msd.png (file) |  |
22 KB | MSD for solid, liquid and gas on one plot. This shows that MSD<sub>gas</sub> > MSD<sub>liquid</sub> > MSD<sub>solid</sub>. | 1 |
| 11:12, 17 March 2017 | RDF allStates.png (file) |  |
41 KB | 2 | |
| 11:10, 17 March 2017 | RDF integrated allStates.png (file) |  |
31 KB | 1 | |
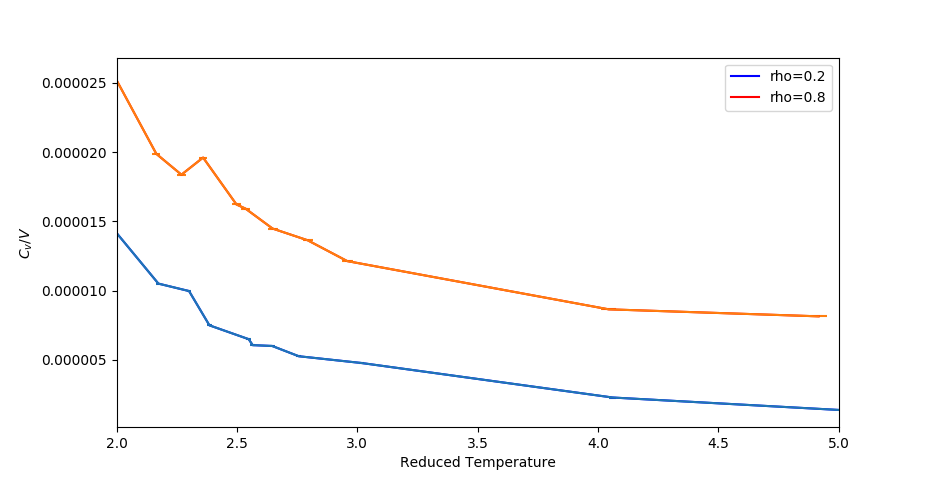
| 15:10, 16 March 2017 | Cv v vs temp.png (file) |  |
33 KB | 2 | |
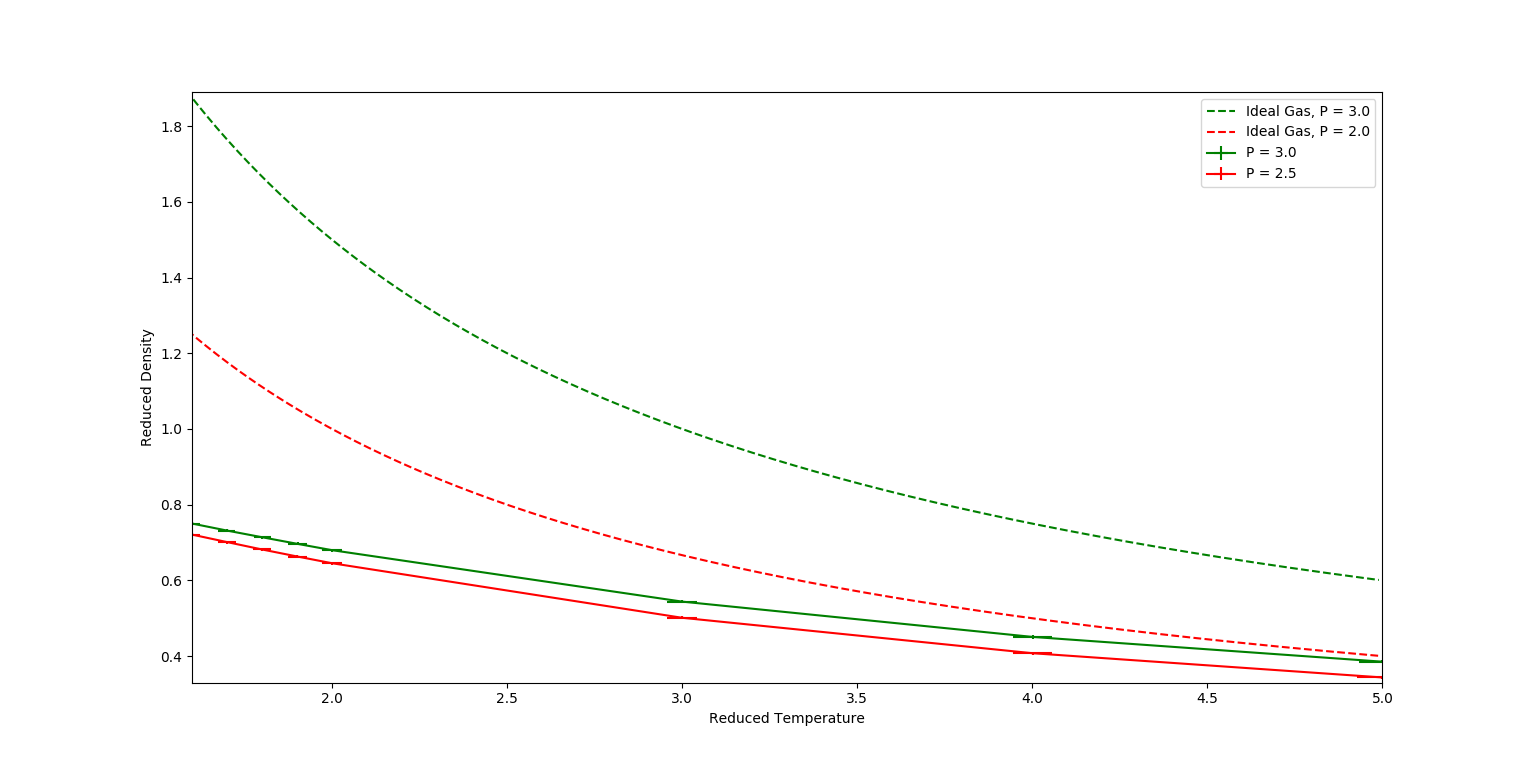
| 15:21, 14 March 2017 | Pressure vs temperature.png (file) |  |
62 KB | 2 | |
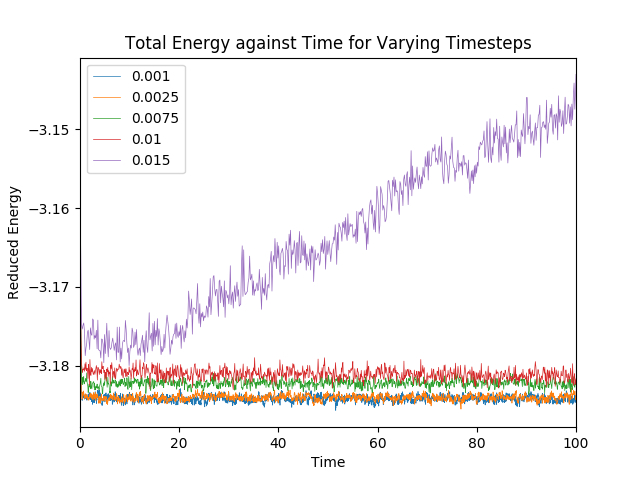
| 14:31, 12 March 2017 | Engvstime.jpg (file) |  |
138 KB | 1 |