Molecular Reaction Dynamics (jr1416)
Reaction of H2 and H
Distinguishing minima on potential energy surfaces
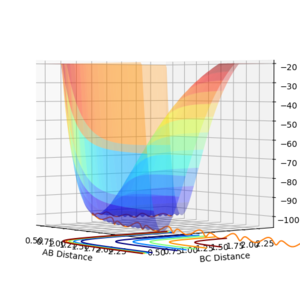
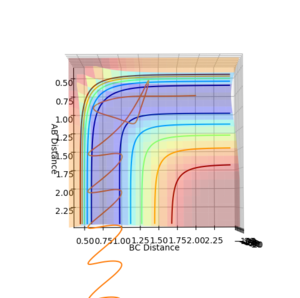
To distinguish where a minimum is on the potential energy surface, may it be a minimum or a transition state, the first derivative with respect to r1 or r2 will be 0, see figure 3. When differentiating between a minimum and a transition state, the second derivative with respect to 2 orthogonal axis should be taken and for a transition state, one positive and one negative value will be obtained, see figure 1 and 2, and for a minimum will give two positive values.
Good--Sw2711 (talk) 18:39, 11 May 2018 (BST)
Determining the transition state
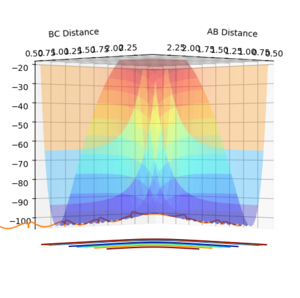
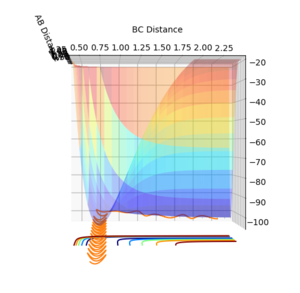
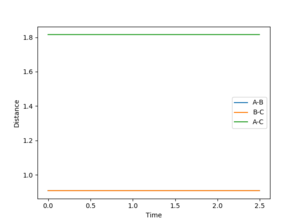
The inter-nuclear distance for the transition state can be found by using a plot of inter nuclear distance vs time for a system with no momentum. The point of transition state can be found by varying the inter-nuclear distances until there is no longer any oscillation between any of the inter nuclear distances, this indicates that all the interactions between the molecules are equal. The value determined by this method was 0.9078 a.u (4 d.p), see figure 1.
Good. I am just not sure whether 'all the interactions between the molecules are equal' is a fair statement. For example, the TS of your FHH system, are all the interactions equal? --Sw2711 (talk) 18:40, 11 May 2018 (BST)
Finding the minimum energy pathway for a reaction
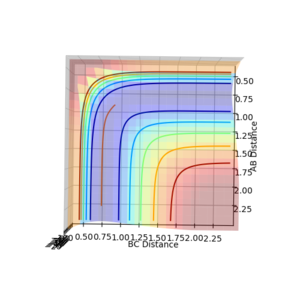
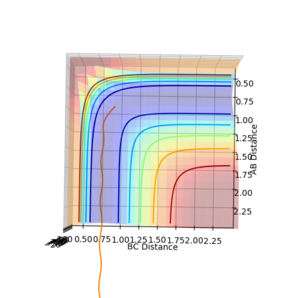
The reaction pathway taken by the molecules is the minimal energy pathway at the lowest point of the potential energy surface possible at a given inter nuclear distance. The minimal energy pathway can be found by changing one of the inter-nuclear distances by an infinitesimally small amount, still with no momentum involved, thus giving a defined diatomic molecule and a single atom. This gives the energy path of these species coming together and not reacting (due to no momentum). The MEP graph shows the pathway for the species coming together if they are treated as 2 solid entities. Whilst the dynamic plot treats the one a diatomic and one as an atom and thus shows the vibration of the diatomic BC.
Fair--Sw2711 (talk) 18:44, 11 May 2018 (BST)
Testing different reaction trajectories
This part is very good--Sw2711 (talk) 18:50, 11 May 2018 (BST)
Using transition state theory
Transition state theory
Transition state theory uses the Quasi-equilibrium assumption that the transition state is in equilibrium with both reactants and products, even when reactants and products are not necessarily in equilibrium. As the transition state can be reformed from products aswell as initially from reactants it is also assumed that the flux of the two transition states is also equal. It also assumes that nuclei behave according to classical mechanics as opposed to quantum mechanics and that the reaction proceeds via the lowest saddle point which is not always true for reactions at high temperature[1].
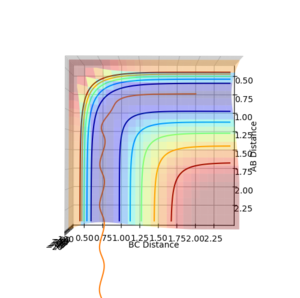
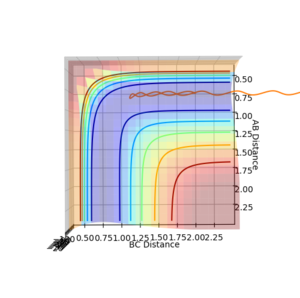
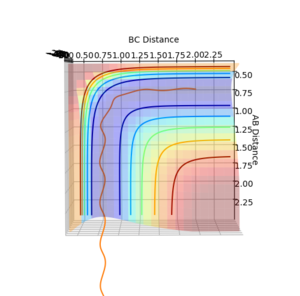
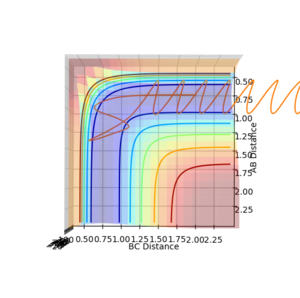
For the reaction carried out at low momentum, trajectories 1-3, the model will give a low rate of conversion due to the fact that the products and reactants are not in equilibrium with one another. For the reaction carried out at high momentum, trajectories 4 and 5, the model will give a more accurate but still low rate of conversion as the products and reactants are closer to equilibrium however, the reaction path does not occur via the minimum saddle point, thus a lower rate will be found using TS theory. Does the quasi-equilibrium/equilibrium point make sense in this exercise though? You're just looking at three atoms in isolation, not treating a statistical ensemble of them.--Sw2711 (talk) 18:47, 11 May 2018 (BST)
Studying H2 + F <--> HF + H
Determining the reaction energies
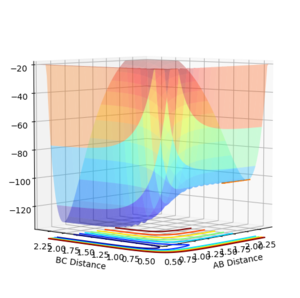
The reaction between H2 and F can be classified as exothermic by inspection of the potential energy surface, as H2 is described as AB, which is higher in energy than BC which corresponds to the molecule HF. This indicates that the bond energy for HF is higher than H2, and that the backward reaction is endothermic.
Good, I just think you forgot to refer to figure 7--Sw2711 (talk) 18:51, 11 May 2018 (BST)
Locating the Transition sate
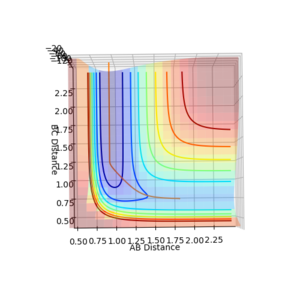
The location of the transition state can be determined by finding the saddle point ( maximum on the minimum energy pathway) at which the first derivative of the the point is zero, this can also be done by varying the parameters of rH-H and rH-F until the point does not move when no momentum has been applied. The H-H distance is found to be 0.744 a.u and the H-F distance is found to be 1.811 a.u.
Good, but I think you forgot to attach the evidence--Sw2711 (talk) 18:52, 11 May 2018 (BST)
Finding the activation energies
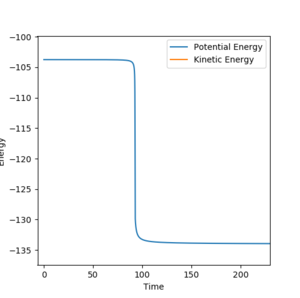
To find the activation energy for the reaction between H2 and F, the transition state can be perturbed slightly to give a system of nearly equal energy but that has an affinity towards H2. This system is rH1-H2=rts and rH1-F=rts+δ. The system then relaxes to the lowest energy to give H2 and F, this is analogous to the reverse of the reaction with the H2 colliding with F and having enough energy to reach the transition state energy. Thus the Energy vs Time graph run using an MEP shown below gives the activation energy for H2 + F --> HF + H is 0.267 Kcal/mol. For the reaction between HF and H the same procedure is carried out but the rH1-H2= rts+δ, then the system will relax to the minimum for H-F. The second energy vs time graph can be used to find the activation energy for HF + H --> H2 + F as 30.208 Kcal/mol.
Good, again, you need to tell me when or where to look at which figure if you've labeled as figure 8-11--Sw2711 (talk) 18:52, 11 May 2018 (BST)


Finding productive reaction conditions
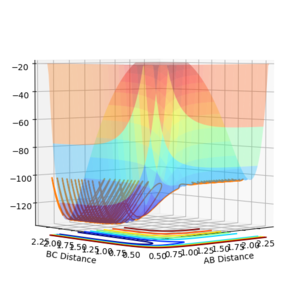
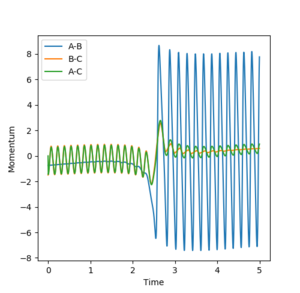
A productive set of initial conditions was determined by varying parameters, these were rF-H=2.3, rH-H=0.74, pF-H=-0.75, pH-H=-1.5. These conditions resulted in a vibrationally excited state molecule of HF, being formed from a molecule of H2 which contains less vibrational energy. Thus from this it can be concluded that due to the conservation of energy, the reaction energy has been converted into vibrational energy in the product. This vibrationally hot product molecule of HF, will inevitably release much of its vibrational energy to the surroundings as heat energy by colliding with other molecules in the gas phase dissipating the energy. To confirm the production of vibrationally excited product molecules the IR spectrum of the products could be taken, which would show relaxation from vibrationally excited states back to the ground state by emitting a photon at the wavelength corresponding to S1-->S0 transition.[2]
Good--Sw2711 (talk) 18:55, 11 May 2018 (BST)
Determining which form of momenta is more efficient for reaction
Polanyi's empirical rule states that vibrational energy is more efficient at driving a reaction with a late transition state than translational energy.[3] The transition state of the reactions, H2 + F --> HF + H and for the reverse reaction HF + H --> H2 + F, were determined earlier in this document, thus by comparing the transition state geometry to the initial condition geometry, either early or late transition states can be assigned. The transition state geometry, rHH=0.744 a.u and rFH=0.811 a.u, resembles the geometry of H2 and F species and thus for the reaction between these 2 species the transition state is early. On the flip side, the reaction between HF and H has a late transition state as the transition state geometry is far away from the initial geometry of the reactants. By calculating the minimum required momentum to give a productive reaction when keeping the other momentum low allows for the dependence on momenta to be established, see table below.
| HF + H --> H2 + F | |||
|---|---|---|---|
| (H-F) Vibrational momentum | (H-H) Translational momentum | Total momentum | Efficiency |
| -0.5 | -9.4 | -9.9 | Low |
| -6.5 | -0.5 | -7.0 | High |
| H2 + F --> HF + H | |||
|---|---|---|---|
| (H-H) Vibrational momentum | (H-F) Translational momentum | Total momentum | Efficiency |
| -0.5 | -2.1 | -2.6 | Low |
| -0.7 | -0.5 | -1.2 | High |
Vibration momentum can be seen to be more efficient than translation momentum in the first reaction which has the late transition state, which abides by Polyani's rules. The reverse is true for the other reaction which exhibits a short transition state and thus shows higher efficiency for translation energy transfer for driving the reaction.
Good--Sw2711 (talk) 18:56, 11 May 2018 (BST)
References
- ↑ Truhlar, D. G.; Garrett, B. C.; Klippenstein, S. J. (1996). "Current Status of Transition-State Theory". J. Phys. Chem. 100 (31): 12771–12800. doi:10.1021/jp953748q.
- ↑ Chemical dynamics of vibrationally excited molecules: Controlling reactions in gases and on surfaces, F. Fleming Crim
- ↑ Evans, M. G.; Polanyi, M., J. Chem. Soc., Faraday Trans., 1936, 32, 1340

