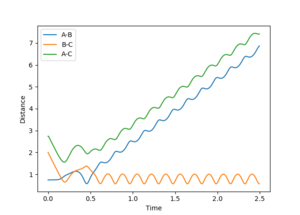
MRD:ARD16
Molecular Reaction Dynamics Report; Arun Dolan
EXERCISE 1: H - H - H system
Introduction
For these experiments I will be assuming the mass of the electron is negligible and ignoring quantum effects, therby usuing classical mechanics to model molecular collisions. This approximation is based on the Born-Oppenheimer approximation.
I will be using a programme which calculates the potential energy surfaces and trajectory of a single atom colliding into a diatomic molcule with colinear geometry.
R1 will be the distance between atom 1 and atom 2. R2 is the distance between atom 2 and 3. At the start atom 2 and 3 are a diatomic and atom 1 is a monotomic. All bond distances are given in angstroms.
Surface Potential Energy Diagrams
What value do the different components of the gradient of the potential energy surface have at a minimum and at a transition structure? Briefly explain how minima and transition structures can be distinguished using the curvature of the potential energy surface.
The potential energy surface diagram can be used to examine the progress of a reaction. The reactants and products are linked by a minimum energy path. The point on this path which has the highest energy is the transition state. The transition state is a saddlepoint because any deviation from the reaction path from the saddle point will produce an increase in energy; except following the reaction path in eiother direction which will reduce the energy. At the transition state the gradient of the potential energy surface in both directions is zero. The potential energy surface is also zero at global minima; ie the reactants and products.
However the transition state can be distinguished from minima because if one starts a trajectory at the transition state with momentum towards a minima it will move towards either the reactants or products. Starting at the minima with a small amount of momentum will cause a small movement before rolling back down to the minima. The points can therefore be distinguished by examining the second derivatives. The transition state is a saddle point so the second derivatives will have component gradients with opposite signs; one negative, one positive. However global minima will have two positive second derivative components.
Mathematically the difference can be expressed in the following manner given that the two directions examined are q1 and q2 and the energy is defined by V. Global minima, maxima and saddle-points will share the property . However saddle-points are unique in having second derivative components with opposite signs such that:
Ng611 (talk) 13:02, 8 May 2018 (BST) Excellent explanation!
Calculating Transition state Geometry
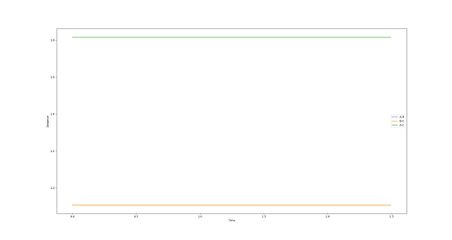
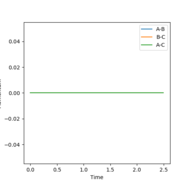
As the atoms are all hydrogens the transition state is symmetric. Therefore r1 = r2. From the above we know that starting a trajectory at the transition state with no momentum will produce a stationary point. The transition state therefore can be found by setting the momenta as equal to zero and the distances r1 and r2 to be the same. Values of r1 and r2 can then be inputted systematically to find a distance which stays constant. As a constant distance requires particles have zero momenta, the momentum versus time curve can be used to refine the transition state distance estimate. Using this method produced a rts = 0.90774250.
Report your best estimate of the transition state position (rts) and explain your reasoning illustrating it with a “Internuclear Distances vs Time” plot for a relevant trajectory.
Figure 1, a plot of internuclear distance versus time demonstrates that when r = 0.90774250 the trajectory remains constant, indicating the gradient of the point is equal to zero, and therefore that the trajectory stays on the ridge. As the point represents either the global minima nor the global maxima the trajectory must be at the transition state.
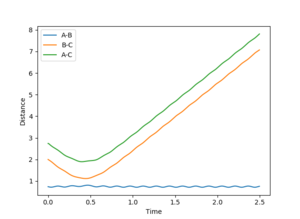
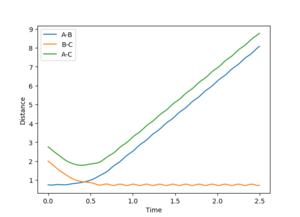
It can be proved this trajectory is at the transition state by examining the interatomic distances versus time plots for r1 = Ts, r2 = Ts+0.01 and r1=Ts+0.01, r2 = Ts. These plots can be seen in the table below. For just a small deviation from the transition state the trajectory rolls down to either product formation, when r2 is displaced, or reactant formation, when r1 is displaced. This behavior is characteristic of a transition state.
| r1 | r2 | plot | |
|---|---|---|---|
| 0.917 | 0.907 | 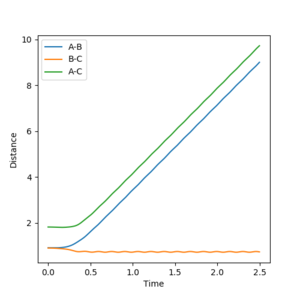 |
|
| 0.907 | 0.917 | 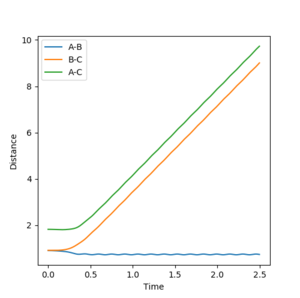 |
Ng611 (talk) 13:03, 8 May 2018 (BST) Well done.
The Reaction Path
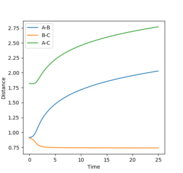
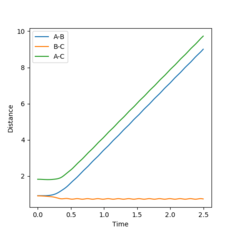
The reaction path is the path of minimal energy from the reactants to products. The calculation type can be changed to MEP, a type which maps out the minimal energy path, by resetting the velocity to zero at each step. Vibration is avoided as it would cause the trajectory to climb up the sides of the energy valley.
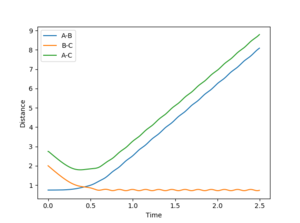
Figure 2 shows a MEP calculation with input conditions of p1=p2=0, and r1=ts+0.01, r2=ts, rts = 0.90774250. Using this calculation the final r1(t) and r2(t) values are 2.02 and 0.74 respectively. The final average momenta are 0.00. (See figure 4)
Figures 3 and 5 show the results from the same calculation repeated but using a dynamic calculation mode. Using this calculation the final r1(t) and r2(t) values are 9.00 and 0.74 respectively. The final momenta are 2.48 for A and 1.24 for B-C.
Comment on how the mep and the trajectory you just calculated differ.
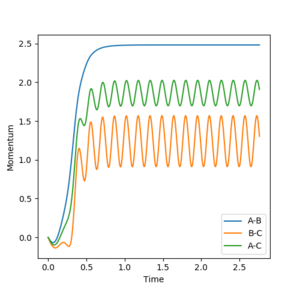
By resetting the velocity at each step the momenta is always zero. Momenta using the dynamic method is allowed to increase, producing vibration of the diatomic, as seen in figure 3. Vibration pushes the molecule out of the minimal energy path, hence why the MEP must reset the velocity to zero at each step. That is why in the mep calculation no vibration can be seen, B-C is a smooth line.The resetting of velocity explains why the final distance A-B is smaller despite an increased number of steps. However final B-C average distances are the same as they both represent the H-H bond length of the formed B-C molecule.
Alternate Calculations
If the calculation was repeated with p1=p2=0, and r1=ts, r2=ts+0.01 then the trajectory would be removed from the transition state in the other direction. Therefore the downhill path would be toward the products and formation of A-B would be observed. The formation of A-B can be seen in figure 6.
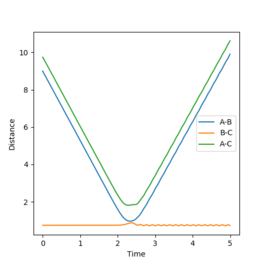
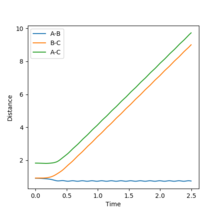
The calculation was then repeated using the positions of the dynamic calculation as the initial position, and the momenta as the final momenta with reversed sign, ie r1=9.00 r2=0.74, p1=-2.48 p2=-1.24. The result is shown in figure 7. The particles collide but there is not enough energy to cross the transition state barrier, instead A gets 0.01 away. Therefore the diatomic B-C and the monotomic A separate after the collision. Such a calculation is just the reverse of the original calculation. It could therefore have been predicted that the trajectory would not have crossed the barrier.
Reactive and unreactive Trajectories
The initial conditions can be examined to see those that produce reactive transitions. The initial positions r1, r2 will be kept at 0.74 and 2.0 respectively.
Complete the table by adding a column with the total energy, and another column reporting if the trajectory is reactive or unreactive. For each set of initial conditions, provide a plot of the trajectory and a small description for what happens along the trajectory.
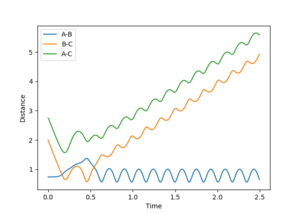
Higher energy reactions do not necessarily ensure the system will be reactive. The lowest energy reaction had too little energy to cross the barrier. As the total energy was increased the energy of the barrier became surmountable and the system reactive. However as the energy was increased further the system started to change between reactive and unreactive for only small changes in energy. This was due to their being enough energy to cross the barrier multiple times. An even number of crossing resulted in an unreactive system, and odd numbers of crossing resulted in a reactive system.
Transition state theory
State what are the main assumptions of Transition State Theory. Given the results you have obtained, how will Transition State Theory predictions for reaction rate values compare with experimental values?
Transition state theory can be used to predict the rate of chemical reactions. Transition state theory assumes that on either side of the barrier the system is in equilibrium[1]. Therefore a reaction has occurred once the barrier has been crossed. However as seen above there are a sub-set of reaction which involve crossing the barrier a number of times. Even number of crosses are unreactive and odd are reactive. Therefore as transition state theory assumes each time the barrier is crossed a reaction occurs; the rate of reaction will be overestimated. Multiple barrier crossing are uncommon for reactions at room temperature. Therefore it is likely that transition state theory will only overestimate the rate of reaction at higher temperatures[2], or in other systems when the available energy far outweighs the energy of the barrier.
Ng611 (talk) 13:05, 8 May 2018 (BST) Very efficient discussion. Well done.
EXERCISE 2: F - H - H system
PES inspection
Classify the F + H2 and H + HF reactions according to their energetics (endothermic or exothermic). How does this relate to the bond strength of the chemical species involved?
The relative energies of the reactions can be examined via the contour plot. The depth of the respective valleys can be used as estimates of the bond strength of the possible diatomics. The entropic contribution to the free energy is likely to be minimal compared to the enthalpic contribution as in each case there are exactly three species before and after the reaction. The depth of F-H valley suggests a bond strength of 136kcal/mol, compared to an H-H bond strength of 104kcal/mol. These values suggest the F + H2 reaction will be exothermic, while the H + H-F reaction will be endothermic.
Locate the approximate position of the transition state.
The transition state can be found using the above method. The hammond postulate suggests the transition state will resemble the species it is closer in energy to. For an endothermic reaction this will be the products and for an exothermic reaction this will be the reactants. Therefore given that H + H-F is endothermic, the transition state will be found towards the H-H side of the valley.
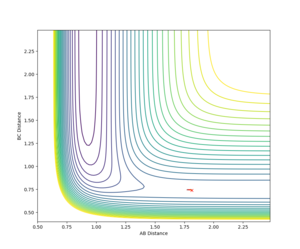
Figure 10 shows the contour plot for the F + H2 reaction. As we know the transition state will be found closer to the H2 side of the reaction therefore it will appear closer to the H-H valley entrance and therefore around the cross on the plot. By setting BC to the H-H bond length, 0.74 and altering the AB distance and examining which way the trajectory falls we can find the transition state. Using this method the transition state can be found at RHH = 0.74, RHF =1.81355165. The proof that the trajectory is at a transition state can be seen in the below table. (Reaction = F + H2)
| r1 | r2 | plot | comment |
|---|---|---|---|
| 1.81355165 | 0.74 | 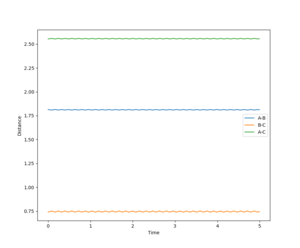 |
At this point the trajectory stays on the ridge indicating it is a transition state. |
Report the activation energy for both reactions.
Now the transition state has been identified the MEP path can be examined to find the activation energy for both reactions. By starting from a structure slightly removed from the transition in the direction of reactants the MEP will follow the path from the transition state to reactants. The energy versus time plot shows the relative energies of the species, where the energy of the transition state minus energy of reactants is equal to the activation energy. Using this method the activation energy of the F + H2 reaction was found to be 0.2kcal/mol. The activation energy of the H + H-F reaction was found to be 30kcal/mol.
| Reaction | Energy versus time plot | activation energy kcal/mol |
|---|---|---|
| F + H2 | 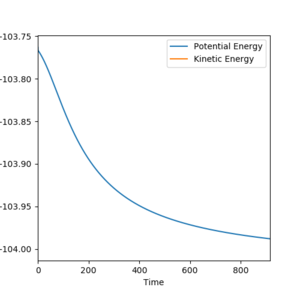 |
0.21 |
| H + H-F | 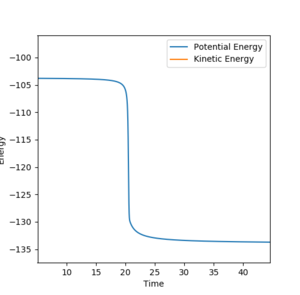 |
29.9 |
Reaction Dynamics
The initial conditions r1= 2.0, r2 = 0.74, p1 = -2.25, p2=-0.5 are reactive conditions for the reaction F + H2 = F-H + H.
In light of the fact that energy is conserved, discuss the mechanism of release of the reaction energy. How could this be confirmed experimentally?
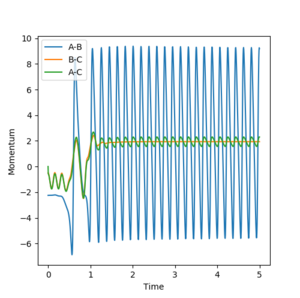
The reaction energy is transformed into a combination of translational energy for the particles and vibrational energy for the newly formed F-H particle. The momenta versus time plot for a reactive trajectory showed the majority of the energy was converted to F-H vibrational energy. Such a hypothesis could be confirmed by experiment by measuring the IR spectrum of the H-F produced in the reaction. If there is a significant population of the higher energy modes than the hypothesis will be confirmed.
In general the mode energy is converted to depends on the timing of the exoergenic (energy) release. Early release leads to energy being transferred into product vibration. Late release leads to energy being converted into translational energy. The release of exoergicity into vibrational motion can be visualised by the energy allowing the products to climb out of the bottom of the potential valley, up the sides of the valley. Such 'climbing' corresponds to vibration. The F + H2 reaction is exothermic so according to hammond's postulate the transition state is early, hence why a significant amount of energy is converted into product vibration[2].
The majority of the energy being vibrational can be seen from figure 15.
F + H2
For the reaction F + H2 where the H-H distance starts at the bond length of 0.74, an initial PFH momenta of -0.5 and F-H distance as 2.0, the momenta of the H-H molecule was varied between -3 and 3.
| PHH | reactive/unreactive | number of times barrier crossed | plot |
|---|---|---|---|
| -3 | unreactive | 2 | 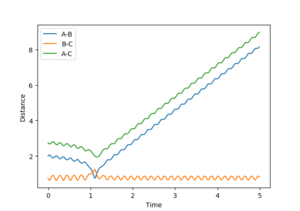 |
| -1.5 | reactive | 3 | 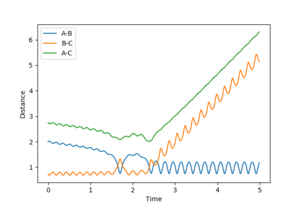 |
| 0 | reactive | 9 | 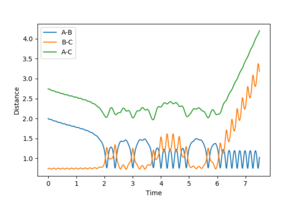 |
| 1.5 | unreactive | 4 | 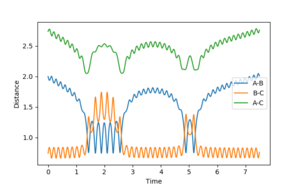 |
| 3 | unreactive | 2 | 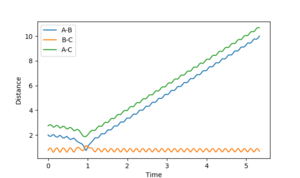 |
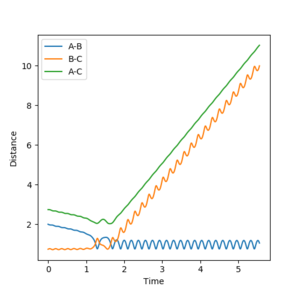
A large PHH momenta in either direction grants H-H significant vibrational energy. For high H-H vibration in either direction that system was unreactive. However at lower vibrational energies the system was reactive.
The reaction with same conditions but initial PHF = -0.8, and PHH = 0.1 can be observed in figure 9. More translational energy and less vibrational energy produced a reactive system.
H + H-F
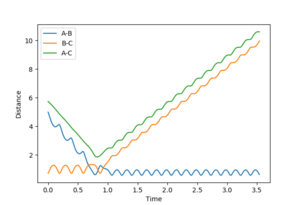
The initial conditions of PHF 0.1, PHH -5.0, r1=5, r2=0.74 represent a hydrogen colliding with high kinetic energy. The reaction is unreactive. A reactive trajectory can be obtained by reducing the kientic energy of the incoming hydrogen and increasing the F-H vibrational energy. The initial conditions PHH = -4.5, PHF = 0.12 produce a reactive trajectory as seen in fig 11.
Interpreting the above results
First a summary of what the calculations for F + H2 and H + H-F revealed. For the F + H2 case, a large amount of vibrational energy for PHH significantly more than the activation energy did not result in a reactive system. Therefore given the large amount of total system energy the reaction was very inefficient. However when the translational energy was increased the reaction became reactive despite lower total energy.
For the H + H-F reaction the reverse was observed. A high translational energy H did not make the system reactive. Instead by decreasing the translational energy and increasing the initial vibrational energy the system became reactive.
These results can be interpreted using Polanyi's rules[2]. Polanyi's rules state that an early transition state requires translational energy for reaction efficiency, and a late transition state requires vibrational energy. The F+H2 reaction is exothermic, and therefore according to hammond's postulate has an early transition state. Therefore translational energy is required. Hence why a large amount of vibrational energy did not make the system reactive. For the second reaction, H + H-F, an endothermic process, according to Hammond's postulate the transition state is late. Therefore vibrational energy is required for an efficient reaction. Hence why in the second case large translational energy did not make the system reactive;the system only became reactive as the vibrational energy was increased.
Discuss how the distribution of energy between different modes (translation and vibration) affect the efficiency of the reaction, and how this is influenced by the position of the transition state
Therefore the position of the transition state governs the mode of energy required for reaction efficency. If the transition state is early then translational energy is required for an efficient reaction. If the transition state is late then vibrational energy is required. A contour plot visualisation can help explain such statements.
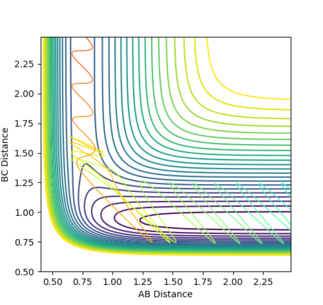
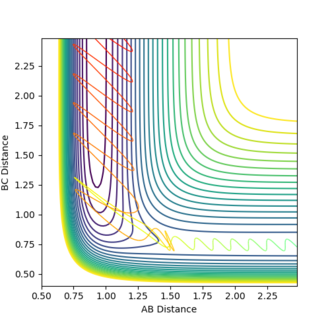
Figure 12 is a calculation with a late transition state, it represents the reaction H + F-H. The late transition state appears at high BC distance and therefore requires a large degree of energy in that direction. For the approaching Hydrogen this means energy perpendicular to the direction of movement and therefore must be in the form of vibrational motion.
Figure 13 is a calculation with an early transition state, from the reaction F + H2, as a result the transition state occurs at high values of AB, and so energy is needed for the incoming molecule in the direction of motion. Therefore high translational energy leads to a more efficient reaction.
Ng611 (talk) 13:10, 8 May 2018 (BST) Good discussion and very good report overall. Well done!

