Sunkiss pl1208 2
Introduction to Inorganic Computational Chemistry
Module one allowed the implementation of different computational techniques towards the rationalisation of organic chemical reactions and characterisation of specific organic molecules. The second module is expected to extrapolate the computational skills learnt; towards the more complex inorganic molecules. In organic molecules, the main elements considered were carbon, hydrogen or halides (high up the periodic table). However, in inorganic chemistry, the type of molecules dealt with could involve transition metal complexes and other heavier elements. This would make calculations carried out to be more resource and time consuming.
Optimisations allow the total minimised energy of different conformers to be attained.This allows determination for which of the possible compounds is a more stable conformer. This determination of the more stable conformer and the location of the transition states or activated complex is essential in fully understanding the mechanism and rationalising the outcome of a reaction. But this cannot be done experimentally and only via the aid of modelling softwares such as gaussian.
The structure of this module comprises of three main segments as follows
- A small inorganic molecule(BH3) will be analysed via geometrical optimisations of the molecule.
- A comparison to evaluate the effectiveness and accuracy of the linear combination of atomic orbitals(LCAO) approach will be carried out. The expected molecular orbitals of the molecule are compared against the computationally derived molecular orbitals.
- A vibrational frequency analysis will be carried out to distinguish the minimum energy level from the transition state. The same approach will then be taken with a heavier G(III) element such as thallium to draw parallels and spot differences in calculations brought about by the substitution for a heavier central atom.
- Molecular modelling of a transition metal complex will be carried out. The importance for the use of Pseudo-potentials and the larger basis sets will be learnt. Also the draw backs of the gaussian software towards inorganic complexes will be understood. The influence of ligands at different positions (cis and trans) has on the overall electronics and strcuture will be analysis via bond length analysis and vibrational analysis as well.
- The final segment will involve a mini-project that looks into the influence of different heteroatoms in benzene analogues. A similar structure in optimisation and vibrational analysis will be undertaken to rationalise the electronic and structural differences.
Optimisation of BH3 via Density Functional Theory (DFT)
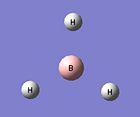
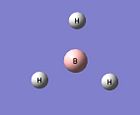
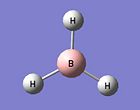
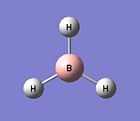
The first segment aims to improve familiarisation of the Gaussian and Gaussview interfaces via simple optimisation calculations of the borane molecule, BH3. The BH3 molecule was first drawn and the trigonal-planar geometry was selected. The Density Functional Theory (DFT)-B3LYP based optimisation was carried out. Pre-optimisation paraments were set-bond distance between B and H atoms as 1.5 Å.
The aim of optimisation was to determine the optimum displacement of the hydrogen nuclei from the boron centre under the BH3 trigonal planar electron configuration. The borane molecule is a small and highly symmetrical molecule with the D3h point group where the orbitals involved are the 1s,2s and 2p orbitals. Thus, a simple basis set such as the 3-21G is sufficient to computationally model and determine the optimum bond distance for the B-H bond.
Results from DFT Optimisation
Borane Optimisation
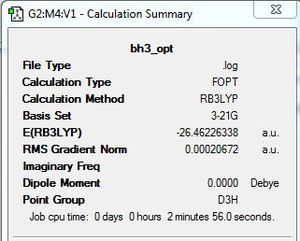
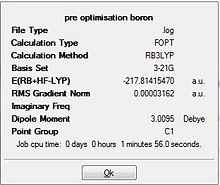
The data in table 2 was extracted from the output log file where the intial bond distance of 1.50 Å was reduced to 1.1944 Å upon optimisation. The optimised H-B-H bond angle was calculated to be 120.0 degrees. When this was compared with literature data (1.18 Å,120 deg) they were in exact agreement with the calculated values.[1] The bond angle can be rationalised being due to the sp2 hybridised centre that subtends the hydrogen atoms at 120 degrees.
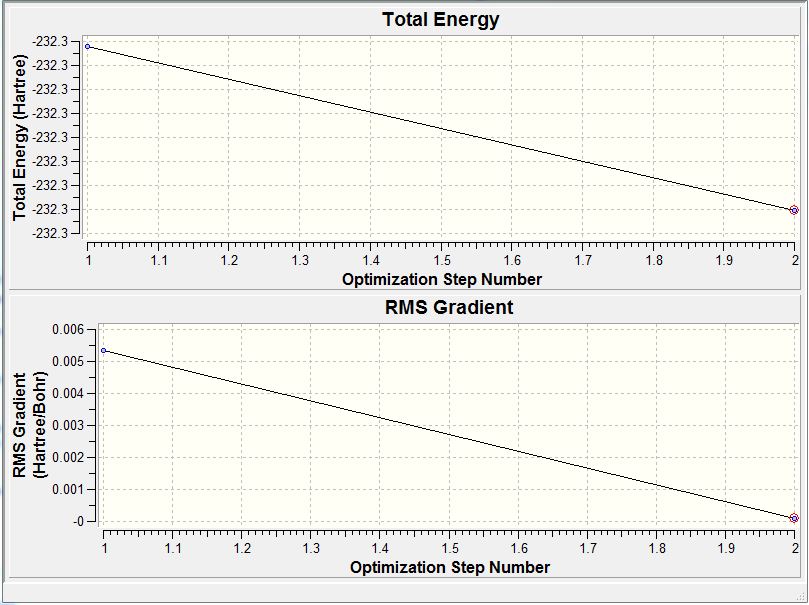
For the calculation summary (diagram 1), results are given in atomic units (a.u.) where the unit conversion is 1 a.u. = 2625 KJ/mol. When the RMS gradient is smaller than 0.001 a.u., the change in potential energy compared against the change in bond length results in an almost horizontal plot. This is indicative that the molecule has been fully optimised.
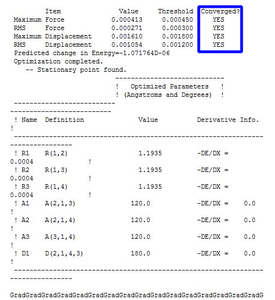
To determine if the reaction had reached completion, the output file was further analysed. For the calculation to have reached completion, derivatives of the forces and displacements must converge. This is true for borane optimisation(outline in blue,diagram 2) which has both force and displacement derivatives having a magnitude lesser than the present threshold value. This is indicative of the convergence; structure is fully optimised.
Further Analysis
 |
 | ||||
 |
|||||
 |
|||||
 |
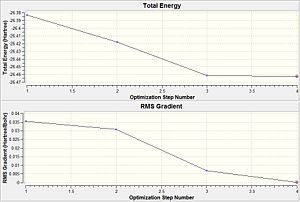
From table 3, the RMS gradient at step 4 is indicative of the completion of the BH3 optimisation calculation. This is because by step 4, the difference in total energy between the pre-optimised and optimised molecule falls below the pre-set threshold value. Another trend observed is as the bond lengths get shorter down the table, total energy of the system becomes more negative. Thus, optimisation involves total energy minimisation where the lowest energy configuration is adopted by bringing the H atom closer to the Boron centre. However, any closer could result in significant van der waals repulsions that would instead cause the total energy to rise. Thus, bond length does not decrease further than the 1.19 amstrongs.
Molecular Orbital Analysis of Borane
LCAO is used to rationalise the shape and geometry of the BH3 molecular orbitals. DFT-based calculations were used to determine the individual molecular orbitals of Borane. The LCAO approach could then be aligned against the DFT-calculated orbitals to determine how accurate LCAO is in predicting the molecular orbitals at the varying energy levels.
Molecular Orbital Diagram attained via the LCAO approach
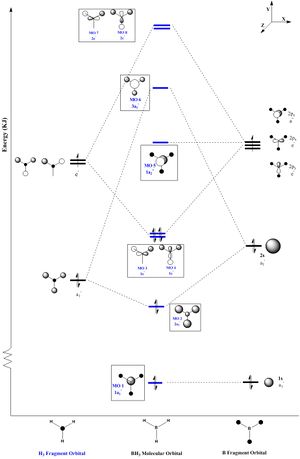
For the formation of the molecular orbitals via the LCAO approach, it was carried out via the linear combination of two fragment orbitals (FO. The two FOs make up 8 atomic orbitals (AO) (Black Lines). As the number of AOs = number of MOs, 8 molecular orbitals are expected from the linear combinations. The extent of splitting in the formation of the molecular orbitals is approximated to the degree of overlap and the difference in energy levels. The smaller the difference in energy levels of the AOs and the greater the degree of overlap, the larger the bonding-antibonding orbitals splitting. The borane molecule has a point group of D3h. Thus, with the aid of the character table, the MO diagram is constructed where each MO is given the symmetry label (in blue).
Molecular Orbitals attained via DFT calculations DOI:10042/to-7458
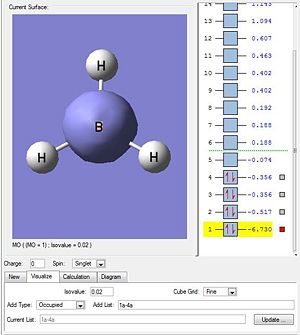
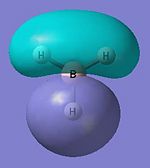
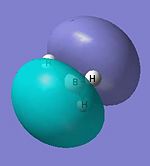
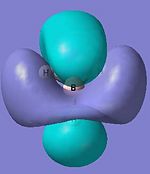
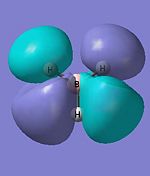
The quantum-based DFT calculations are expected to be more accurate as it takes into account electron and orbital interactions. It is expected to give a more accurate representation of the actual molecular orbitals. The geometrically optimised BH3 output file was ran via SCAN to yield the results in diagram 4. It is clearly seen that the first four (lowest) MO levels are occupied. This is similar to that depicted in the earlier drawn MO diagram via LCAO (diagram 3).
Comparing DFT against LCAO
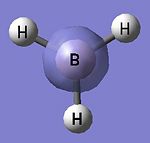
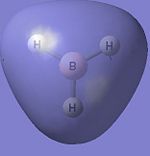
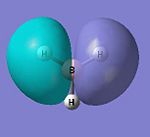
| Molecular Orbital(Lowest to highest energy) | MO predictions via LCAO | Orbital Symmetry ( LCAO ) | DFT Calculation Depiction | Orbital Symmetry ( DFT ) | Energy relative to H Atom (amu)via DFT |
|---|---|---|---|---|---|
 |
 |
||||
 |
 |
||||
 |
 |
||||
 |
 |
||||
 |
 |
||||
 |
 |
||||
 |
 |
||||
 |
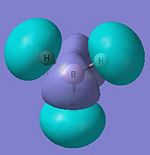 |
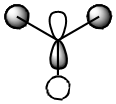
The MO diagram attained via LCAO is in close agreement with the individual molecular orbitals calculated via the Gaussian energy function. When the order of the calculated MOs are compared with the predicted MOs against increasing energy levels, the following conclusions were made.
Both methods have very similar orbital representations from MO-1 to MO-8. They are very similar but not exact due to the difference in arrangement of the 2 highest anti-bonding orbitals (MO-7 and MO-8) which have an energy difference of 0.004 Hartrees. This shows the first limitation of the LCAO. By having such a small energy difference, the two anti-bonding orbitals are able to interchange positions bringing about the slight deviation for the order of LCAO molecular orbitals against the actual energy-based ordering of the DFT calculated orbitals.
The limitation of LCAO is that it is not able to derive the specific energy levels and is based on the assumption that the higher the degree of overlap, the greater the orbital splitting. It was expected that the al' fragment orbitals have a strong splitting due to the high degree of S-S orbital overlap. However, it could not be quantitatively determined if the splitting would have the 3al' MO to be higher than the 2e' molecular orbitals. These are degenerate molecular orbitals formed via side-side p-orbital overlaps which were less effective and resulted in a lesser extent of splitting. In LCAO, it was assumed that the P-P splitting was not large enough for the antibonding 2e' orbital to be of a higher energy the 3al' antibonding MO. But by DFT, it was proven otherwise as seen in the table above.
Pictorially comparing LCAO MOs against DFT MOs, it is concluded that LCAO gives a very good approximation to the shape and size of the orbital lobes where the larger the lobe the greater the electron density about that atom. Comparing the filled molecular orbitals (MO-1 to MO-4), LCAO is very accurate in terms of the orbital phases and relative size of the lobes for the electron occupied molecular orbitals.
However, for the unoccupied MOs, there is a more significant deviation of the predicted LCAO orbital's shape and lobe size from the actual orbital's shape and size derived via DFT methods. For example, in general the Hydrogen orbitals in MO-5 to MO-8 were much larger than predicted in the LCAO. MO 3al' due to the much larger antibonding phase was expected to have a large central orbital surrounded by 3 smaller and opposite phases about each of the hydrogen. But instead, DFT reveals that all the 4 atoms have almost equal size in orbitals. This can be reasoned as the unoccupied orbitals being unfilled, have a more diffused character which makes it harder to accurately predict to the molecular orbitals. Thus, they usually result in the calculated orbitals to have a much larger, diffused lobe than expected.
In conclusion, apart from the minor deviations LCAO is able to give a good prediction of the orbitals. But the potential for deviations can be inferred and be expected to become more significant when larger molecules with more orbitals are involved. Since the potential for orbital-mixing occurs; making the small energy differences more likely and harder to predict via LCAO.
Natural Bond Order (NB0) Analysis of Borane DOI:10042/to-7458
The NBO analysis carried out allows the electronic distribution within the molecule to be quantitatively calculated. This can be done to produce numerical values to complement the general conclusions made about the electron distribution within the molecule.
Considering the orbitals, Boron being tri-substituted has a total of only 6 electrons in the valence shell. It is expected to be electron deficient as it has not achieved the stable octet configuration. Thus, availability of the unoccupied Pz orbital makes the compound to be lewis acidic. Being tri-substituted, the boron centre is expected to be SP2 hybridised; the S-orbital to P-orbital contributions to the hybridised orbital should be the 1:2 ratio.
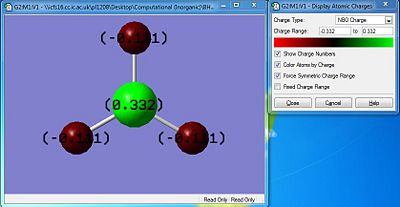
Using the colour depiction, regions coloured red are indicative of high electron density localised at that specific position (atom) while green is indicative of a region of low electron density which is indicative of electron deficiency. In the diagram, all 3 hydrogens with their valence S-orbital fully filled are electron rich as compared to the borane centre which is colour green due to only 6 of the 8 needed for full valence shell. Thus, as predicted earlier the compound is electron deficient about the centre and is an ideal site for an nucleophilic attack. Similarly, the charge numbers are indicative of the electron density about the atom. -0.101 abotu the H atoms denotes the electron rich region while a the 0.322 about the boron denotes an electron deficient site.
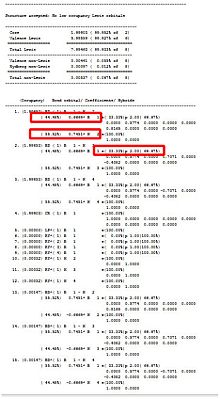
The gaussview provided the pictorial interface but no specific NBO data was given. Thus, analysis of the log file allowed the above section to be isolated and the following conclusions to be made. For each boron-hydrogen bond, the Boron centre contributes 44.48% of the electron density while the hydrogen contributes 55.52%. There is a greater contribution by the Hydrogen-S orbitals than the Boron orbitals. The second red box shows that the boron based orbitals have 33% s character and 67% p character. This will be in the 1:2 ratio indicative of the sp2 hybridised centre. The contribution to the hydrogen is 100% s character. The sp2 centre is as expected and explains the trigonal planar geometry of the molecule. The 100% s-character of the H atom is due to the s-orbitals being the only energetically available orbitals. Thus, NBO analysis can be also used towards justifying the D3h point group since it aids in rationalising the trigonal planar geometry adopted.
Vibrational Analysis of Borane
Introduction & Purpose of Vibrational Analysis [2]
 |
 |
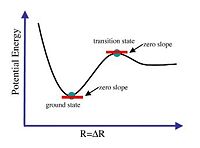
Vibrational analysis determines if the optimisation of the molecule has gone to completion or failed. Complete optimisation of a molecule should result in the minimum potential energy which is defined as the ground state (diagram 7). This is mathematically determined by calculating the gradient of the potential energy surface (PES). When the gradient is zero, it is indicative of a convergence. But as seen in the diagram 7, both the transition state and ground state have the first derivative (gradient) to be equal to zero. Thus, the first order differential is inaccurate in determining if the optimisation is complete as it could be zero but at the transition state.
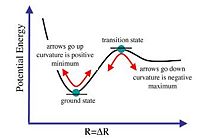
The nature of the turning point (second derivative is < 0 ), is a maximum turning point indicative of the transition state (diagram 8). This indicates that the optimisation is not complete. But when second derivative is > 0, it is at the minimum point and indicates that optimisation is complete (diagram 8). Thus, when the curvature is negative it is represented by a negative vibrational frequency. There is no negative vibrational frequency in real life but when given as a negative value it is due to the nature of the turning point (maximum). Thus, when there are negative vibrational frequencies, optimisation can be concluded to have been carried out towards transition state instead of the ground state. This would mean the optimisation effort is not completed or has failed. This analysis will be applied to the BH3 molecule optimisation efforts.
Vibrational Analysis
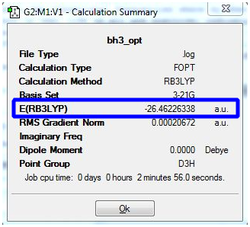
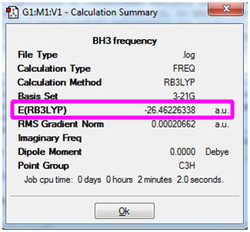
Upon completion of the Gaussian frequency calculation, the completed file had to be checked to see if the calculation was successful. This was done by comparing the E(RB+HF-LYP) energy against the energy attained via the BH3 optimisation initially carried out. The results are expressed in the table below. The highlighted segments from the table below show that both have exactly the same energy which was indicative that the frequency optimisation was successful.
| BH3 Optimisation | BH3 Frequency calculation |
|---|---|
 |
 |
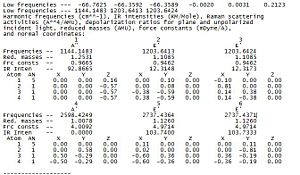
The log file is further analysed via specific analysis of the low frequencies segment as shown in diagram 11. In the line that says 'low frequencies' there are a total of 6 different frequencies that correspond to the '-6' in the formula 3N-6 vibrational frequencies. The 6 vibrational frequencies are representative of the motions of the centre of mass of the molecule. They are much smaller than the first vibration listed.
There is a change in the point group for BH3 molecule from D3h to C3h in the frequency output. However, the point group should still be the D3h and not the C3h as the molecule still being trigonal planar has the 3 planar reflections perpendicular to the principal axis of rotation. A summary for the justification of D3h is provided below and will be the point group with associcated symmetry elements used instead of the C3h point group.
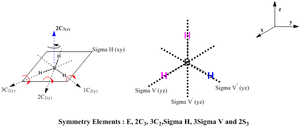
As the D3h point group has been justified, the expected molecular vibrations are to be aligned against the character table for the D3h point group.

DOI:10042/to-7460 (Checkpoint file for the following vibrational results)
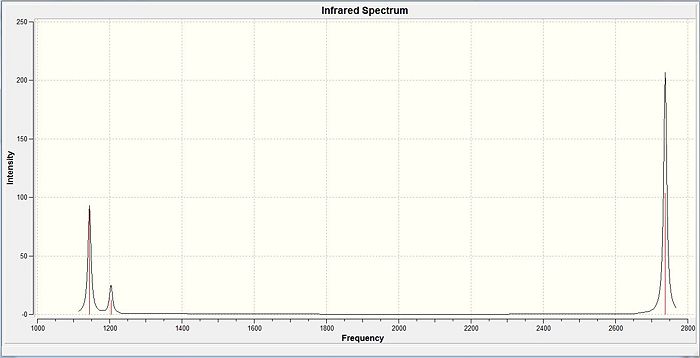
As it was concluded that the fully optimised structure was obtained, frequency analysis was carried out. The positive frequency values are indicative of a minimum point (which is what we hope to see !) while a negative frequency is indicative of the formation of the transition state. However, more than one negative frequency is indicative of an incorrect end result since the critical point is not derived and is indicative of an incomplete optimisation. The IR spectra shows the vibrations stretches expected.
| No. | Type of Vibration | Model of Vibration | Description Of the vibration | Calculated Frequency/cm-1 | Literature Frequency/cm-1 [6][7] | Intensity | Associated Symmetry D3h Point Group | |||
|---|---|---|---|---|---|---|---|---|---|---|
| 1 | Out of Plane Wagging |
|
It is the concerted movement of all 3 hydrogen atoms perpendicular to the σh plane, makkng it out-of plane. The boron central atom moves in the opposite direction by a very small displacement relative to the hydorgen's displacement | 1144 | 1141 | 92.9 | A2' | |||
| 2 | In-Plane Scissoring |
|
The two hydrogen atoms moves towards each other in a scissoring which results in the central boron atom to be displaced slights as the hydrogen atoms get closer in the σh plane | 1204 | not reported in literature | 12.3 | E' | |||
| 3 | In plane rocking |
|
It involves the scissoring motion of two hydrogen atoms similar to the above, and the other hydrogen atom wags sideways in the plane. Both 2 and 3 are degenerate forms of each other | 1204 | not reported in literature | 12.3 | E' | |||
| 4 | symmetric stretch |
|
All 3 hydrogen atoms are displaced in the σh plane where they move in and out together whilest the central boron atom remains stationary | 2598 | 2860 | 0 | A1' | |||
| 5 | Asymmetric stretch |
|
One of the hydrogen atom remains in a fixed position while the other 2 move in opposite displacements where by when one moves away from the boron centre the other moves closer to the boron centre. The boron centre will very a very small displacement relative to that of the hyodrogen atom's | 2737 | 2720 | 103.7 | E' | |||
| 6 | Asymmetric stretch |
|
All 3 hydrogen atoms are displaced in the σh where by two of the hydrogen atoms are in sync where by when both move towards the boron centre the other hydrogen atom moves away from the central boron where there is minimal displacement by the boron centre. | 2737 | 2720 | 103.7 | E' |
In view of giving the specific numerical data provided by Gaussian, the frequencies of vibrations were corrected to the nearest integer while the intensities were rounded off to the 1st decimal place. This was done so as to allow the inaccuracies and errors with the harmonic approximation in the calculation to be accounted for. There are errors expected since these anharmonic vibrations have been modelled using the harmonic approximations.
All the values presented above are of a positive magnitude indicative of the minimum turning point. Thus, proving it has been optimised to the ground state and not the transition state; optimisation has been successful. The values are within range of the literature values for the frequency vibrations.
It is noticed that the calculations yields 6 different vibrational frequencies. But when compared with the IR spectra, only 3 peaks were seen. This is because, vibration NO. 2 AND 3 are degenerate of each other and will only be displayed as a single peak. The same is expected of vibrations 5 AND 6 which are also degenerate. Thus, these 2 pairs of degenerate frequencies yield only 2 individual peaks. Vibration 4 has zero intensity since there is no change in the dipole moment resulting in a 'Non-IR active stretch' which explains it's zero intensity. Therefore, only 3 peaks seen ( 1, 2&3 and 5&6)which agrees with literature IR spectras which also only show 3 different vibrational frequencies.
Psuedo-Potentials implemented towards DFT Optimisation of TiBr3 tri-halide
For a simple molecule like borane which is made up of elements from the first two periods, the total number of electrons is small allowing the smaller basis set to be implemented towards the vibrational and NBO type analysis. But for Thallium tri-bromide type molecules which form a 186-electron system require a much larger basis set and greater computational resources. This brings about the implementation of the Psuedo-Potentials (PP) where they will be able to substitute the non-valence electrons in the system by which implementing an effective potential. This effective potential being the Pseudo-potential of the many-electron system replaces the non-valence electrons with the (PP) to bring about faster computational processing.
This makes TiBr3 which has a total of 186 electrons an ideal candidate to test the (PP) approach since a non-(PP) approach via the quantum based DFT calculation will be very time consuming and not worth the time and resource allocated. Comparing the basis set used for the BH3 with TiBr3, the tri-halide needs a much larger basis set as there are a greater number of electrons so a greater range of orbitals will be expected to be occupied. Thus, the basis set used accommodates a larger range orbitals and fully describe them to realistic details. The larger basis set, LanL2DZ set will be implemented to fully describe all the available orbitals of the tri-halide. LanL2DZ basis set is a combination of two basis set (D95V) which is ideal for the first row element and to accurately map the much heavier element, it has the Los Alamos ECP subset. [8]
Results from Optimisation
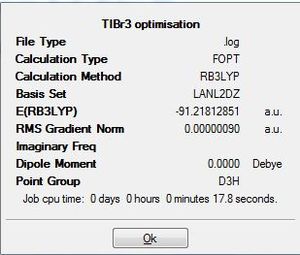
TiBr3 Optimisation Log File DOI:10042/to-7461
 | |||||||
|---|---|---|---|---|---|---|---|
|
| ||||||
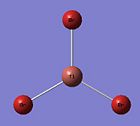
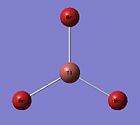
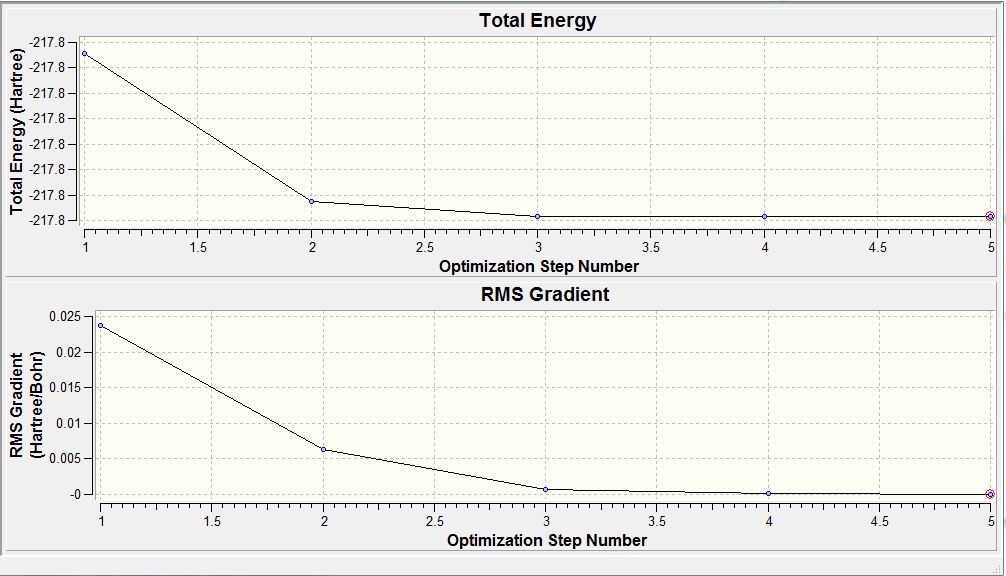
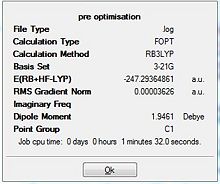
Similar to the BH3 optimisation steps undertaken, the TiBr3 molecule was analysed before and after the optimisation by paying specific attention to the bond length and the angle it was subtended at. Both the molecules had the Br-Ti-Br bond to be at 120.0 degrees. Comparison of the 2 bond lengths shows the slight reduction of the bond towards the optimisation. The gradient showed that the RMS graident has a value lesser than 0.001 a.u. ; indicative that the optimisation is complete. This was a similar analysis to that of the BH3 optimisation carried out earlier. The only difference is that for the TiBr3 which has very larger halides as well as the central atom Ti, has the possibility of adopting the pyramidal form to be more sterically stable. Thus, the D3h point group was fixed to ensure that all the structures had the same point group. This ensured that the molecule stayed in the trigonal planar orientation even after optimisation.
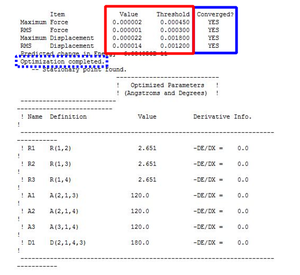
The derivatives of the force and displacement have a value lesser than the present threshold value (red box). This shows a convergence and is indicative of a complete optimisation of the TiBr3 molecule. Similar to the BH3 analysis, the output file was then used to carry out further analysis.
Further Post-Optimisation Analysis
 |
 | ||||
 |
|||||
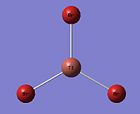 |
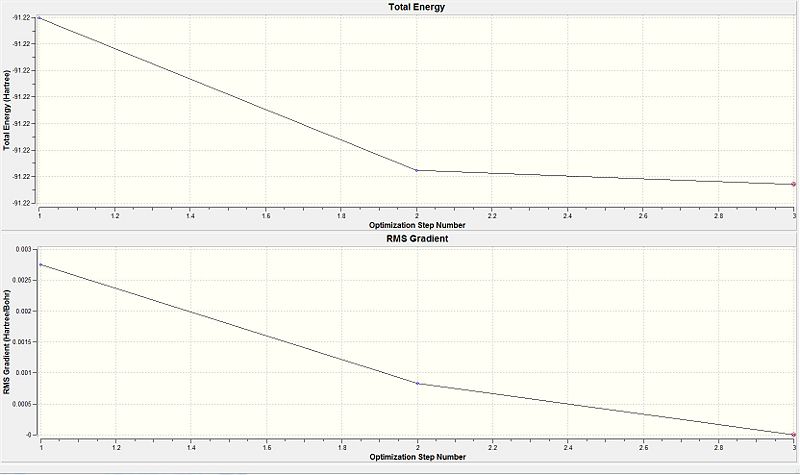
For the larger and more electron containing TiBr3 molecule, the (PP) only considered the valence electrons. Comparing the graphical data provided in the table 8, it is seen that at optimisation step 3, the gradient value is almost at zero. Furthermore, the derivatives are lesser than the present threshold. Both are indicative that the optimisation of the TiBr3 molecule was complete. Initially the Ti-Br bond length was given as 2.69 Å (optimisation step 1) and upon the successive two optimisation steps the Br atoms were brought closer to the Ti centre. This resulted by step 3 for the minimised bond distance to be 2.65 Å. However, according to literature the bond length was given as 2.52 Å. [9] This accounts for the limitation in using the (PP) as it does not consider all the electrons in the molecule and only the valence electrons. Thus some deviation from the experimental was expected. A larger more accurate basis could be considered as it would be describe the orbitals more accurately and give a value closer to that of literature.
Vibrational Analysis of TiBr3
Thallium Tribromide Vibrational Analysis
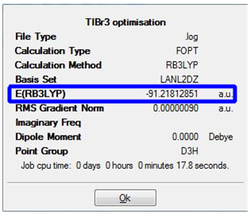
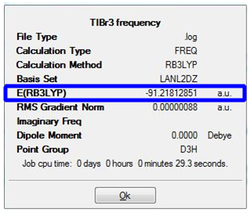
Upon completion of the Gaussian frequency calculation, the completed file had to be checked to see if the calculation was successful. This was done by comparing the E(RB+HF-LYP) energy against the energy attained via the TiBr3 optimisation initially carried out. The results are expressed in table 9. The highlighted segments from the table show that both have exactly the same energy which was indicative that the frequency optimisation was successful.
| TiBr3 Optimisation | TiBr3 Frequency calculation |
|---|---|
 |
 |
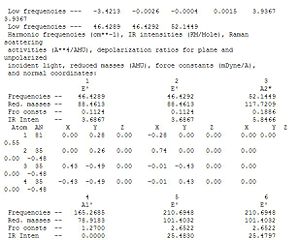
The log file is further analysed via specific analysis of the low frequencies as shown in diagram x. In the line that says 'low frequencies' there are a total of 6 different frequencies that correspond to the '-6' in the formula 3N-6 vibrational frequencies. The 6 vibrational frequencies are representative of the motions of the centre of mass of the molecule. Thus are much smaller than the first vibration listed. Further more, as the highest frequency in the 'low frequency' row is row is of 1 order of magnitude smaller than the lowest frequency in the normal vibration modes (diagram 17). It can be concluded that the calculation result are valid and further analysis can be undertaken.
A summary for the justification of D3h is provided below and will be the point group with associated symmetry elements used.
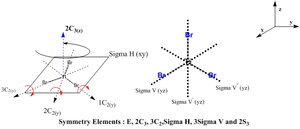
As the D3h point group has been justified, the expected molecular vibrations are expected to aligned against the character table for the D3h point group.

The positive frequency values are indicative of a minimum point (which is what we hope to see !) while a negative frequency is indicative of the formation of the transition state. However more than 1 negative frequency is indicative of an incorrect end result since the critical point is not derived; indicative of an incomplete optimisation.
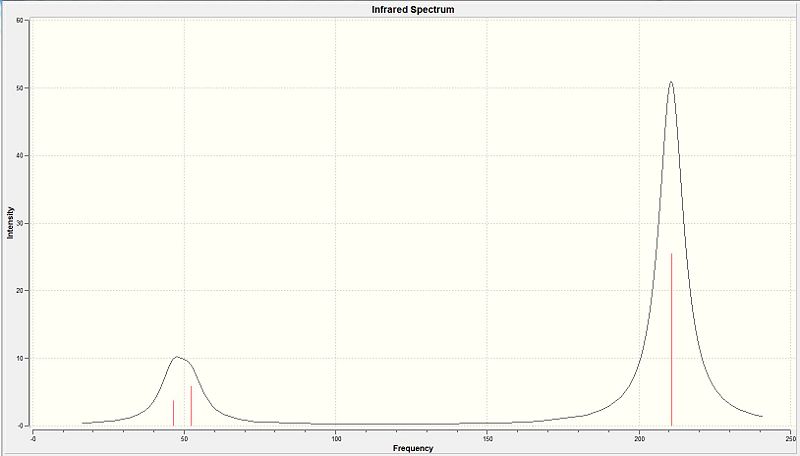
| No. | Type of Vibration | Model of Vibration | Description Of the vibration | Calculated Frequency/cm-1 | Intensity | Associated Symmetry D3h Point Group | |||
|---|---|---|---|---|---|---|---|---|---|
| 1 | In plane-scissoring like motion |
|
The two bromine atoms moves towards each other in a scissoring which results in the central thallium atom to be displaced slightly as the two bromine atoms get closer in the σh plane. The other bromine atom has a much smaller displacement in the opposite direct to the two bromine atoms | 46 | 3.7 | E' | |||
| 2 | In plane rocking |
|
When the two bromines are seen to be moving in one direction the other bromine is moving in the opposite direction 'rocking' relative to the other two. The thallium centre is seen to have minimal displacement. All the displacements are in the σh plane | 46 | 3.7 | E' | |||
| 3 | Out of plane wagging |
|
It involves the concerted movement of all three bromine atoms where they have displacement perpendicular to the σh plane. The thallium also has distince displacement where it has the opposite direction of displacement relative to the bromines displacement | 52 | 5.8 | A2 | |||
| 4 | symmetric stretch |
|
All 3 bromine atoms are displaced in the σh plane where they move in and out together whilest the central boron atom remains stationary | 165 | 0 | A1' | |||
| 5 | Asymmetric stretch |
|
One of the bromine atom remains in a fixed position while the other 2 move in opposite displacements where by when one moves away from the thallium centre the other moves closer to the thallium centre. The thallium centre will have a side to side displacement in the plane | 211 | 25.5 | E' | |||
| 6 | Asymmetric stretch |
|
All 3 bromine atoms are displaced in the σh where by two of the bromine atoms are in sync where by when both move towards the thallium centre the other bromine atom moves away from the central thallium where there is minimal displacement by the thallium centre. | 211 | 25.5 | E' |
Analysis of the IR spectra shows that only 3 distinct peaks are observed. However, 6 different vibrational modes have been computationally calculated. But of the 6 modes, NO 5 AND 6 are a degenerate pair and only contribute to 1 peak. Similarly NO. 1 AND 2 are also a degenerate pair and contribute to only 1 peak. The final peak is accounted for by NO.3 vibrational mode (Table 10). The IR spectra corresponds to the literature frequencies. [11] NO.4 vibrational mode being the symmetric stretch would have a zero dipole moment making it a non-IR active vibrational mode which explains why it has an intensity of zero and is not seen in the IR spectra nor in literature at that vibrational frequency of 165 cm-1.
Compare and Contrasting the TiBr3 against BH3 vibrations
| No. | Order of stretches in the BH3 molecule | Order of stretches in the TiBr3 molecule |
|---|---|---|
| 1 | Out of plane wagging | In plane-scissoring like motion |
| 2 | In plane scissoring | In plane rocking |
| 3 | In plane rocking | Out of plane wagging |
| 4 | symmetric stretch | symmetric stretch |
| 5 | Asymmetric stretch | Asymmetric stretch |
| 6 | Asymmetric stretch | Asymmetric stretch |
Table 11 summarises the order of the vibrations for both BH3 and TiBr3 in acending energy content. A comparison can be accurately carried out since both have the D3h point group symmetry and both have been calculated using the same minimal basis set. Both molecules have same number and same types of vibrational modes (3N-6) where N=4. However, there is a different order of the vibrational modes between the two molecules. One such change would be the Out of plane wagging which was the lowest vibrational wave number in BH3 but in TiBr3 it has increased in vibrational wavenumber to NO.3 from NO.1.
This can be rationalised as being due to the significant change in mass of the central atom from B to Ti and from H to Br. Both the changes result in an increase of the reduced mass. Wagging involves the out-of-plane movement of the atoms, TiBr3 having a larger reduced mass would have much more energy in incurred in the vibration. It is easier for a less heavy molecule to wag than a more heavy one. Thus the wagging has a higher energy content in TiBr3.
Additional Questions
1. In some structures gaussview does not draw in the bonds where we expect, does this mean there is no bond? Why?
This problem was encountered in the optimisation of both the BH3 and the TiBr3 molecule. This problem with 'invisible' bonds is due to a software limitation. Gaussview 5 which was used for the optimisation efforts has predetermined bond lengths and when two atoms are within this predefined bond length, the bond is 'visible' in Gaussview. Thus during optimisation, the bond lengths are varied through different optimisation steps until the optimisation with the minimum energy is reached. Thus for the intermediate optimisation steps which has the bond lengths beyond the predefined distance, they will be appearing 'invisible. This is more evidently seen in this module as compared to the previous module as the software has the predefined distances mainly catering for organic molecules and complexes. However, based on MO analysis carried out, it is seen that the software despite having 'invisible' bonds would still recognise there is electron density delocalised between the two atoms of the 'invisible' bond.
2. What is a bond?
Based on the definition from IUPAC a bond is defined as chemical bond between two atoms or groups of atoms in the case that the forces acting between them are such as to lead to the formation of an aggregate with sufficient stability to make it convenient for the chemist to consider it as an independent "molecular species .[12]
However, this is a very vague representation of a chemical bond as it does not include any description about the delocalised electron density expected between the two atoms forming the bond. The bond being formed is a covalent bond and is held together by electrostatic interactions between the two nuclear centres which have similar electro-negativity.
Another type of the bond is the ionic bond which is formed between two nuclear centres when they have significant electronegative difference result in unequal sharing of the bonds. Thus, forming the ionic bond or dipoles when there is still delocalised electrons between the nuclear centres.
Isomer Analysis of Mo(CO)4(PPh3)2
Introduction
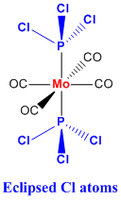
The transition metal complex Mo(CO)4(PPh3)2 displays cis-trans stereoisomerism. In the second year inorganic lab course, the Molybdenum complex was synthesised as part of an experiment where identification of the isomers was carried out via analysis of the number of CO vibrational stretches observed in the individual IR spectras. The cis isomer had four carbonyl absorption bands while the trans isomer had a single absorption band. Computational methods of analysis are expected to faciltiated similar identification and characterisation of the different isomers.
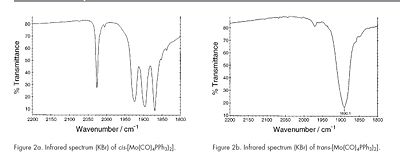
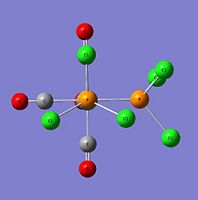
As carried out in the earlier exercise, the respective isomers will be optimised and vibrational analysis will be carried out to determine if the computationally attained results draw parallels with the experimental data attained for the two isomers. However, the triphenyl phosphine ligands used presented some computational problems towards effective optimisation of the metal complex. This was mainly due to the three phenyl rings. The aromatic planar rings resulted in the computational calculation to be carried out via a 360 degree rotation about each phenyl ring. As there were six such rings, this will lead to many localised energy minimas that posed as pseudo-ground states. Furthermore, the rings being sterically hindering, required a demanding amount of computational resources (Diagram 21). Thus, another ligand substituent was used with minimal influence to the expected outcome.
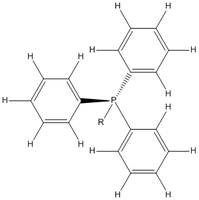
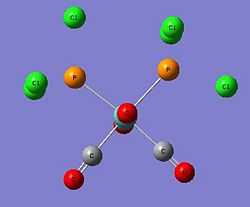
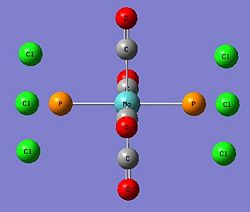
The computationally less demanding chloride ligands were used to approximate the phenyl rings in the PPh3 ligands. They had similar electron-withdrawing capabilities and similar electronic contribution to the phosphorus centre. They were sterically quite large but favourably imposed a much lesser computational demand (Diagram 22).
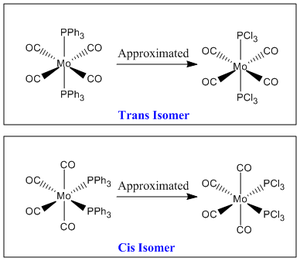
Approach taken towards Effective Optimisation of both isomers
Optimisation of the ground state structures will be carried out in three successive optimisation steps. The first optimisation involves the usage of a low basis set via the B3LYP method. This set defined as LANL2MB serves as a loose optimisation to give a rough approximation of the optimised structure.
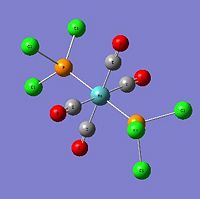
The second step towards optimisation involves rearrangement of the dihedral angles of the P-Cl bonds in both isomers to facilitate the successive optimisation. This step allows the re-orientation of the bonds to that expected of the final optimised product. This ensures the next optimisation will be done from the better start point that ensures the true lowest minimum point is achieved and not 'stuck' in a psuedo-ground state energy conformation(Diagram 23).
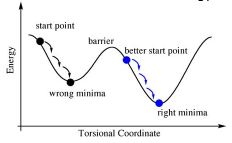
The final optimisation effort will use a larger and more accurate basis set defined as LANL2DZ.
First Optimisation
Cis Isomer Initial Optimisation Log File DOI:10042/to-7464
Trans Isomer Initial Optimisation Log File DOI:10042/to-7465
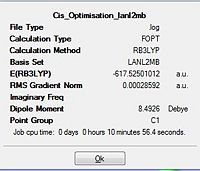
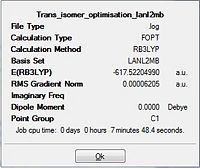
The optimisation using the DFT-B3LYP method via a low level basis set (LANL2MB) gave a rough optimisation since the 'opt=loose' was entered to ensure the convergence criteria was prevented from being more accurate than the method being used. If it was not prevented then the convergence will happen even before the method is complete causing the optimisation to fail. LAN2MB comprised of more than one basis set; it is specifically made up of the (i) STO-G3 set which is specific for the first row elements (ii) Los Alamos ECP (iii) MBS for Na-La and Hf to Bi (essentially all the other elements). [15] [16]
 |
 | |
|
|
Total energy of the Cis isomer upon the first optimisation is -617.5250 a.u. while the trans isomer had an energy of -617.5220 a.u. The difference between the two isomers being 0.0030 a.u. corresponded to ca. 9 KJ mol-1(a small energy difference between the two isomers). As the energy difference between the two isomers are almost equal, they would be labile at room temperature. This could be avoided by reconsidering the type of ligands used. The steric influence could be increased by having more bulky ligands such as PPh3 that makes the cis-isomer much more unstable. This results in the energy difference between the two isomers to become significantly larger; allowing selectivity for one isomer over the other since the steric influence plays a greater role in the cis isomer relative to the influence it brings to the trans isomer.
This was an interesting result as the trans product which had the significantly lesser steric clash was expected to be more readily formed and have a much lower energy level as compared to the cis isomer which has the bulky ligands adjacent to each other. However, it is too soon to rule out the influence of sterics since the reaction under kinetic control has not been looked into. According to literature sources, the cis isomer is the kinetically stable product that isomerises to the thermodynamically stable trans isomer.[17] As this is only the rough optimisation, the validity of this statement is yet to be verified and will be done so upon the successive optimisations.
The RMS gradient for both isomers is less than 0.001 a.u. (indicating convergance). Hence suggesting that the optimisation has reached a completion. Thus, further analysis via the log file can be considered since it is a completed optimisation.
| Bond length (Å)/ Bond Angle (deg) Compared | Literature Trans isomer [18] | Calculated Trans Data |
|---|---|---|
| Bond length (Å)/ Bond Angle (deg) Compared | Literature Cis isomer [19] | Calculated Cis Data |
|---|---|---|
A comparison of the key bond lengths against literature was carried out for the trans isomer. However the same was not replicated for the cis isomer as there no literature data available for that isomer. Instead, the crystallographic data for the complex where L=PPh3 was used. This was a sound comparison since apart from the two ligands, it is a similar transition metal complex which allowed bond comparisons to be made. Comparing the Mo-CO bond in both isomers, the bonds trans to the PR3 ligands are shorter than the bonds cis to the ligands. Similary the Mo-P bonds in the trans isomer is shorter than those in the cis isomer. This is because, the cis has the bonds slightly elongated to minimise the non-favourable non-bonding interactions between the bulky ligands adjecent to each other.
However, the calculated data varies significantly from the literature data especially for the trans which was compared against the same compound. This was the first indication that the basis set used was not very effective in the optimisation efforts and raises the need for a secondary optimisation to be carried out.
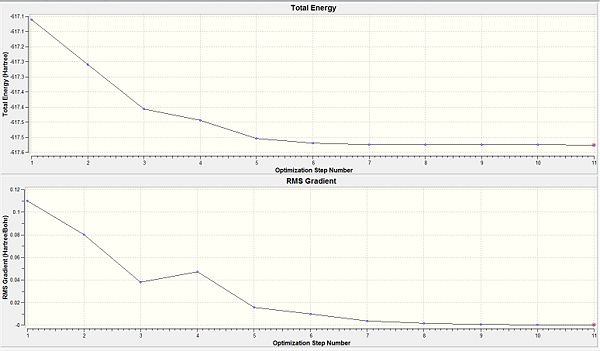
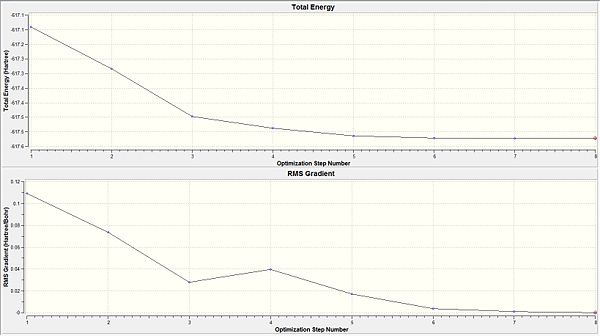
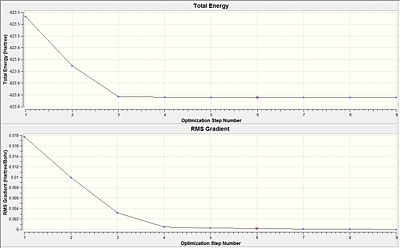
From both the diagrams, it is rationalised that the larger molecular structure brings about a need for additional optimisation steps as compared to a smaller molecule like BH3 which only needed 6 steps to be fully optimised. The 'horizontal effect' seen shows that the level of accuracy implemented by the calculation is not very much higher than the convergence criteria and so it has the horizontal stagnation of the total energy towards convergence. This shows that a more accurate basis set should be adopted instead.
Second Optimisation
This step involves the 'manual' realignment of both Phosphrous based substituents by defining the dihedral angle between the Cl-P-Mo-CO for both the isomers as shown below. The 'manual' adjustment will facilitate the second optimisation to give the lowest energy conformer for both the isomer and not a psuedo-lowest if it got 'stuck' in a intermediate minimum point.
 |
|
 |
|
Third Optimisation
Cis Isomer Second Optimisation Log File DOI:10042/to-7469
Trans Isomer Second Optimisation Log File DOI:10042/to-7468
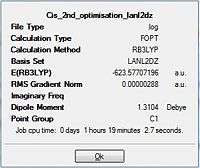
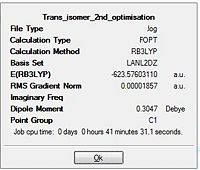
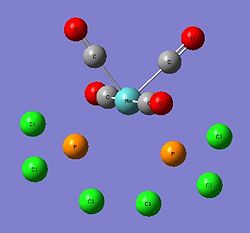
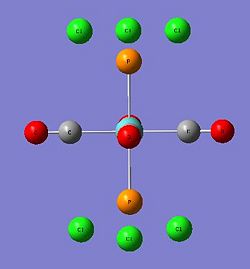
The final optimisation efforts involved use of the more accurate LANL2DZ pseudo-potential basis set. This resulted in a more accurate optimisation the isomers. The additional keywords "int=ultrafine" and "scf=conver=9" added enabled a tighter convergence criteria to be imposed to ensure the minimum energy level was attained.
 |
 | |
|
|
Comparing the RMS gradient of the second optimisation(Table 15) against the first optimiasation (Table 12) shows that the gradient via the second optimisation result is much more closer to zero as compared to that in the first optimisation. This could be due to the tigher restrictions imposed on the convergence that bring about a much more significant optimisation of the isomers.
In both the first and the second optimisations, the trans-isomer is thermodynamically more stable than the cis-isomer. However, the second optimisation results in the difference between the energy levels to increase to a difference of about 40 KJ/mol from about 9 KJ/mol. Although the energy gap is not large but it shows that the second optimisation results in a more accurate depiction of the thermodynamically more stable trans isomer. This is rationalised since it does not have the un-favourable non-bonding interactions that the cis-isomer is subjected to. As stated before, much larger ligands could be considered if the energy gap is to be more distinct.
| Bond length (Å)/ Angle (deg) Compared | Literature Trans isomer [20] | Calculated (second optimisation) |
|---|---|---|
| Bond length (Å)/ Bond Angle (deg) Compared | Literature Cis isomer [21] | Calculated Cis Data |
|---|---|---|
Comparisons made between the literature and calculated values for the trans isomer have little difference in values. The cis was compared with a different ligand based isomer so slight deviations can be anticipated. But overall the deviations were minimal suggesting that the optimisation via the pseudo-potential basis set was more accurate.
Both the optimisations have the Mo-C bonds to be shorter than the Mo-P bonds. This could be due to the steric bulk of the PR3 ligands and the backbonding of the Metal to the antibonding orbital of the CO pi*. The back-bonding increases the electron density between the Mo and the C of the carbonly and a shorter bond length is representation of greater delocalised electron density between the two atoms. Hence the shorter Mo-C bond since Mo-P does not have such back-bonding interactions. This results in the slightly distorted octahedral (mainly due to steric) that results in the C1 point group instead of C2v.
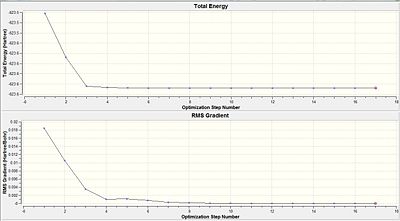
Conclusion towards Optimisation efforts
From the analysis of the changes to the bond lengths and bond angle, the second optimisation does bring the computationally modelled complex closer to that of literature. If a larger more accurate basis set was used, the differences against literature data can be expected to be further minimised.
Vibrational Frequency Analysis
The frequency calculations were carried using the same method and basis set as that of the optimisation. This ensures accurate comparisons could be made. As mentioned in the introduction segment (Diagram 21), the different isomers can be distinguished from each other based on the number of CO stretches observed. This will be the key observation followed up via computational vibrational frequency analysis.
Analysis of the Cis-Metal Complex
Vibrational Analysis Cis Isomer Log File DOI:10042/to-7482
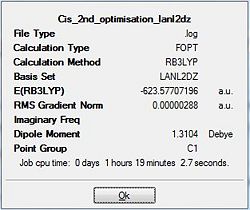
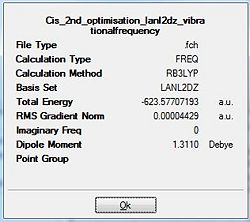
Upon completion of the Gaussian frequency calculation, the completed file had to be checked to see if the calculation was successful. This was done by comparing the E(RB+HF-LYP) energy against the energy attained via the optimisation initially carried out. The results are expressed in the table below. Table 19 shows that both have exactly the same energy which is indicative that the frequency optimisation was successful.
| Cis Isomer Optimisation | cis Isomer Frequency calculation |
|---|---|
 |
 |
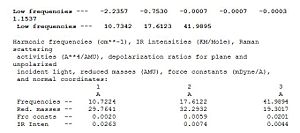
The log file is further analysed via specific analysis of the low frequencies segment as shown in diagram 30. In the line that says 'low frequencies' there are a total of 6 different frequencies that correspond to the '-6' in the formula 3N-6 vibrational frequencies. Further more, as the highest frequency in the 'low frequency' row it is 1 order of magnitude smaller than the lowest frequency in the normal vibration modes. It can be concluded that the calculation results are valid and further analysis can be undertaken.
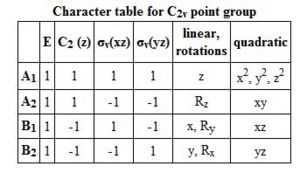
The Cis-isomer having the C2V point group symmetry will have the carbonyl bond stretches assigned based on the symmetry elements of the point group.
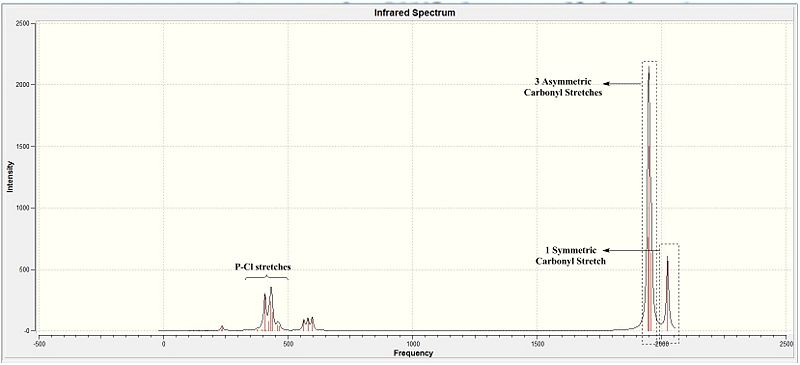
The IR spectra as expected would show the presence of multiple peaks in the carbonyl region of about 1900 cm-1. These correspond with the literature IR spectra (Diagram 21). Table 20 provides more detailed analysis into the bond stretches.
| No. | Model of Vibration | Description Of the vibration | Literature Frequency/cm-1[22] | Calculated Frequency/cm-1 | Intensity | Associated Symmetry C2v Point Group | |||
|---|---|---|---|---|---|---|---|---|---|
| 1 |
|
The Equatorial carbonyl stretches vibrate out of phase with respect to each other. Similarly, the Axial carbonyl stretches also vibrate out of phase with respect to each other. Comparing the extent of the vibrations, the equatorial carbonyls have a greater displacement than the axial carbonyls. | 1986 | 1946 | 761 | B2 | |||
| 2 |
|
The Equatorial carbonyl stretches vibrate out of phase with respect to each other. Similarly, the Axial carbonyl stretches also vibrate out of phase with respect to each other. Comparing the extent of the vibrations, the axial carbonyls have a greater displacement than the equatorial carbonyls. | 1994 | 1949 | 1501 | B1 | |||
| 3 |
|
The Equatorial carbonyl stretches vibrate in phase with respect to each other. Similarly, the Axial carbonyl stretches also vibrate in phase with respect to each other. However, the two set of carbonyl vibrations are out of phase with respect to each other. | 2004 | 1959 | 636 | A1 | |||
| 4 |
|
The Equatorial carbonyl stretches vibrate in phase with respect to each other. Similarly, the Axial carbonyl stretches also vibrate in phase with respect to each other. The two set of carbonyl vibrations are in phase with respect to each other. | 2072 | 2024 | 595 | A1 |
The table shows the 4 different carbonyl bond stretches seen in the cis isomer. All 3 possible asymmetric vibrations and the fully symmetric vibrations by the carbonyls are accounted for. These corresponding to the 4 peaks seen in literature make the computationally calculated results reliable to a large extent. This is theoretically viable as all the stretches bring about a change in the dipole and would make them IR active.
However, comparisons of the attained values against literature is indicative of an approximate ~50 cm-1 error in all the compounds. This as initially explained is a internal error of the software since the calculations of anharmonic functions are carried out via an harmonic approximation. This brings about a 10% error in the computationally calculated results and thus the deviation from literature is observed.
| No. | Model of Vibration | Description Of the vibration | Literature Frequency/cm-1[23] | Calculated Frequency/cm-1 | Intensity | Associated Symmetry C2v Point Group | |||
|---|---|---|---|---|---|---|---|---|---|
| 5 |
|
The P atoms were stationary with the Cl atoms 'rocking' about them. The displacement of the Cl ligands were out of phase with the Metal-carbonyl (MoCO4) displacements | - | 10.7 | 0.03 | - | |||
| 6 |
|
The Cl ligands rock about the non-fixed P atoms where by the CO ligands rock out of phase with respect to the Cl ligand's displacement. The transition metal had a fixed centre. | - | 17.6 | 0.008 | - |
The table 21 shows the two low energy frequencies that complemented the fact that the structure were optimised. This is because the frequencies in the table are positive which was indicative that the second derivative was positive and the turning point was a minimum point. This accurately describes that of the ground state minima instead of the transition state maxima.
Analysis of the Trans-Metal Complex
Vibrational Analysis Trans Isomer Log File DOI:10042/to-7471
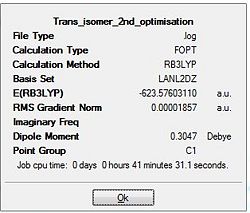
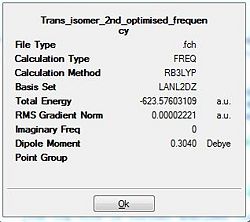
Upon completion of the Gaussian frequency calculation, the completed file had to be checked to see if the calculation was successful. This was done by comparing the E(RB+HF-LYP) energy against the energy attained via the optimisation initially carried out. The results are expressed in the table below. Table 22 shows that both have exactly the same energy which is indicative that the frequency optimisation was successful.
| Trans Isomer Optimisation | Trans Isomer Frequency calculation |
|---|---|
 |
 |
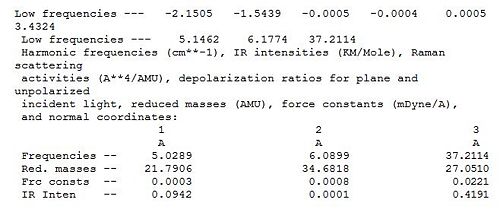
The log file is further analysed via specific analysis of the low frequencies segment as shown in diagram 30. In the line that says 'low frequencies' there are a total of 6 different frequencies that correspond to the '-6' in the formula 3N-6 vibrational frequencies. Further more, as the highest frequency in the 'low frequency' row it is 1 order of magnitude smaller than the lowest frequency in the normal vibration modes. It can be concluded that the calculation results are valid and further analysis can be undertaken.
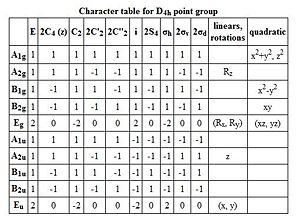
The Trans-isomer having the D4h point group symmetry will have the carbonyl bond stretches assigned based on the symmetry elements of the point group.
| No. | Model of Vibration | Description Of the vibration | Literature Frequency/cm-1[24] | Calculated Frequency/cm-1 | Intensity | Associated Symmetry D4h Point Group | |||
|---|---|---|---|---|---|---|---|---|---|
| 1 |
|
Only upon close observations will the equatorial carbonyl appear to have very minimal stretches. The axial carbonyls have strong vibrations and would vibrate out of phase relative to each other. By relative comparisons, the equatorial carbonyls are assumed to be stationary. | 1896 | 1950 | 1475 | Eu | |||
| 2 |
|
The Axial carbonyls bonds do not vibrate. But the Equatorial carbonyl stretches strongly vibration where both the vibrations are out of phase. | 1896 | 1951 | 1467 | Eu | |||
| 3 |
|
The axial carbonyl stretches are in phase with each other. The equatorial carbonyls vibrate in-phase as well. But the axial carbonyl stretches have a similar vibrational stretching magnitude to the equatorial carbonyl stretches. But the axial stretches are out of phase with respect to the equatorial stretches. | - | 1977 | 0.61 | B1g | |||
| 4 |
|
The axial carbonyl stretches are in phase with each other. The equatorial carbonyls vibrate in-phase as well. But the axial carbonyl stretches have a similar vibrational stretching magnitude to the equatorial carbonyl stretches. The axial stretches are in phase with respect to the equatorial stretches. | - | 2031 | 3.73 | A1g |
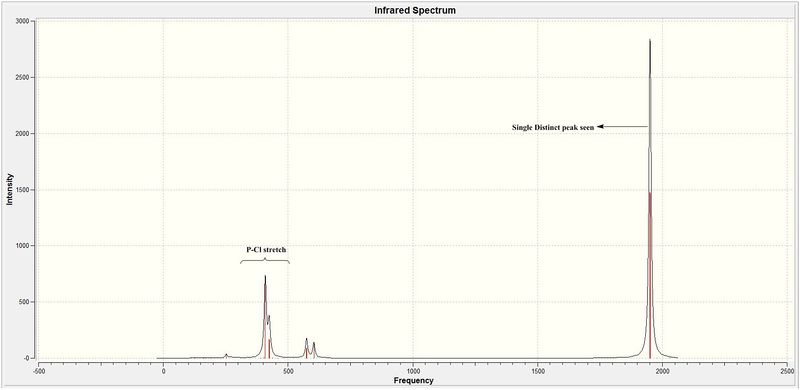
The reasons for the deviation from the literature expected stretches would be the same reason as that explained earlier. For the trans isomer, 4 carbonyl stretches were noted (table 23). However, only one peak is seen in the IR spectra. This is rationalised by the following reasons.
- The trans isomer has a very different point group symmetry (D4h) as compared to the cis isomer (C2v). Thus, it is noted that the D4h point group brings about a greater order of symmetry for the trans isomer than for the cis isomer. This higher order of symmetry is expected to influence the bond stretches seen since higher symmetry usually results in less intense peaks seen.
- From the table No.1 AND 2 would have very similar type of carbonyl stretches (just different axis) so the expected change in dipole moment is going to be the same.They are thus theoretically expected to be degenerate to each other and only contribute to a single peak in the spectra. However, computationally they are non-degenerate vibrations having slightly different vibrational frequencies differing only by 1 cm-1. But they are so close they overlap and are seen as a single peak.
- No2 and 3 have all 4 carbonyl moving about the highly symmetric molecule that results in the dipoles trying to cancel out each other. This result in the overall dipole moment to be very small and would explain why they are not significant enough to be seen on the IR although computationally accounted for.
| No. | Model of Vibration | Description Of the vibration | Literature Frequency/cm-1[25] | Calculated Frequency/cm-1 | Intensity | Associated Symmetry D4h Point Group | |||
|---|---|---|---|---|---|---|---|---|---|
| 5 |
|
The phosphrous centres remain fixed while the Cl substituents rock about these fixed centres. The central (MoCO4) core has a rocking that is out of phase to the Cl's rocking displacement | - | 5.03 | 0.10 | - | |||
| 6 |
|
The axial carbonyls remain in their fixed position and so does the P centres. The Cl ligands rock about the fixed P centres. But the rocking of one PCl3 unit is out of phase to the other PCl3 unit. The equatorial carbonyl ligands have a very small rocking effect that is perpendicular to the rocking of the Cl substituents. | - | 6.09 | 0.0001 | - |
Conclusion
Although the computationally calculated values correspond to the literature values to differentiate the cis from the trans isomer. This is only done against the PCl3 references. At the start of the experiment, the PPh3 ligand was replaced with PCl3 as it was defined as a good substituent theoretically. This has yet to be proved experimentally and will be done via table 25 and 26 which compares the calculated Ir Carbonyl bond stretches against that of literature where the ligand is PPh3.
| Calculated C=O stretches(cm-1) | Literature C=O stretches(cm-1)[26] |
|---|---|
| Calculated C=O stretches(cm-1) | Literature C=O stretches(cm-1)[27] |
|---|---|
From both the tables, it can be seen that although the PCl3 was justified initially and is indeed computationally less demanding, it is how ever not the ideal replacement for the PPh3 ligand. This can be justified by the difference in the values to be rather significant and beyond that of the software error of 10%. Thus other ligands could be considered and tested for suitability in substituting the PPh3 ligand.
Mini Project : Detailed Analysis of Boron and Nitrogen Analogues of Benzenes

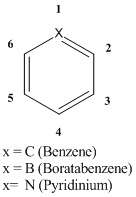
The mini project carried out will aim to compare, contrast and rationalise the specific structures, bond stretches and the electronic characters of the three different analogues of benzene (Diagram A).
Introduction to the three different analogues
Pyridinium ion
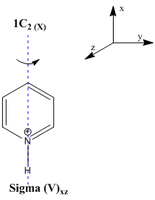
Pyridinium is the cationic form of pyridine where due to the positive charge being localised on the nitrogen centre it can be readily used as an organic base in chemical reactions. The cation has a pKa of 5.2 which is very close to that of acids such as Acetic acid which has a pKa of 4.8.[28] This is because the heteroatom being from group 5 in the periodic table has an electronegativity of about 3.04 on the pauling scale. This makes it distinctly electronegative and would favourably lose the proton (H-N) to remove the +1 charge. The pyridinium ion having the C2(x) and sigmav symmetry elements would belong to the C2v point group symmetry.
Benzene
Kekulé was the first to introduce the sensible structure for benzene where all the 6 carbon atoms are arranged in a hexagon. All the carbons in the plane being of equal electronegativity (2.5 on the pauling scale) would have equal electron sharing and would form covalent bonds. The carbon not being as electronegative as nitrogen has an pKa of 43. This highly large value is indicative that it would not be as easily deprotonated as the carbon would not readily hold on to a (-) charge. Benzene has a D6h point group symmetry due to the C6 rotation along the principal axis and the planar reflection along sigma(h)
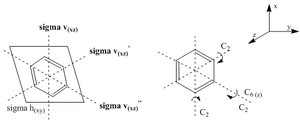
Pyridinium ion
Boratabenzene having the boron heteroatom forms a heteroaromatic compound similar to that of pyridinium -both would have the same point group symmetry of C2v. However, chemically they are very different since boron has an electronegativity of 2.04 on the pauling scale. The presence of the anionic charge is expected to increase the electron density of the ring. Thus, making it more favourable to reactions such as Diels-alder reactions which result in the loss of aromaticity to form borabarrelenes type compounds.[29]
Aims of the Mini Project
- The influence of the different heteroatoms (B and N) are expected to bring about different influences to the benzene ring which as benzene has equal charge / electron distribution. Hence benzene has equal C-C bond lengths. The utility of an effective basis set to optimise the individual analogues to the lowest configuration. This will then be compared against literature to determine the accuracy of the basis set used and to validate the literature results where applicable.
- The key factor for influences is the difference in electronegativity of the heteroatoms. Thus, an NBO analysis will be carried out to justify the pKa values stated for pyridinium ion and benzene while proving the hypothesis for the pKa of the boratabenzene.
- A vibrational frequency analysis will be carried out to complement that the lowest energy conformation is indeed computationally attained. Also the differences between the bond stretches in the different analogues will be accounted for and rationalised.
- Finally an MO analysis will be carried out to justify the electronic nature of the analogues and facilitate in justifying the pKa values as well as the C-C bond stretches.
Optimisation of the 3 Analogues
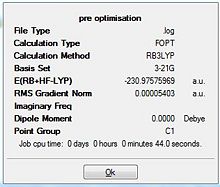
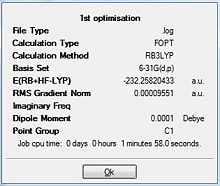
The method adopted for the optimisation was the Density Functional Theory (DFT) via the B3LYP (Becke, three-parameter, Lee-Yang-Parr) exchange-correlation functional. Initially the 3-21G basis set was used to attain a 'rough' optimisation for each analogue. Upon the first optimisation, a more accurate basis set was adopted 6-31G(d,p) to be carried out in the post 3-21G optimised analogues. This basis set was deemed to be more accurate since the 3-21G basis set was of 3 primitive GTO for core electrons where 2 were for inner valence orbitals and 1 for outer. This was a poor representation and was deemed only useful for preliminary geometry optimisation but poor for energy minimisation. The 6-31G(d,p) basis set adds polarisation to all atoms and thus better improves the modelling of the core electrons. This allows more accurate energy minimisation. For this project it will be chosen as the basis set as it leads to convergence to present threshold value (to be seen) and is the best compromise of speed and accuracy.
|
| |||||||
 |
 | |||||||
 |
 | |||||||
| 3-21G Benzene Optimisation6-31G(d,p) Benzene Optimisation |
|
| |||||||
 |
 | |||||||
 |
 | |||||||
| 3-21G 1-H-Boratabenzene Optimisation1-H-Boratabenzene Optimisation |
|
| |||||||
 |
 | |||||||
 |
 | |||||||
| 3-21G Pyridinium Optimisation6-31G(d,p) Pyridinium Optimisation |
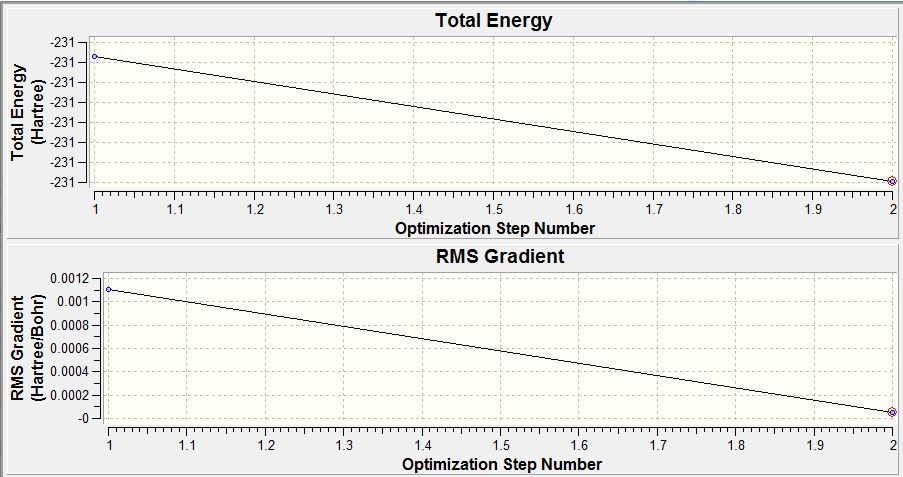
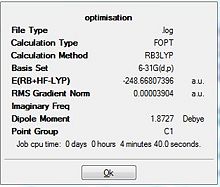
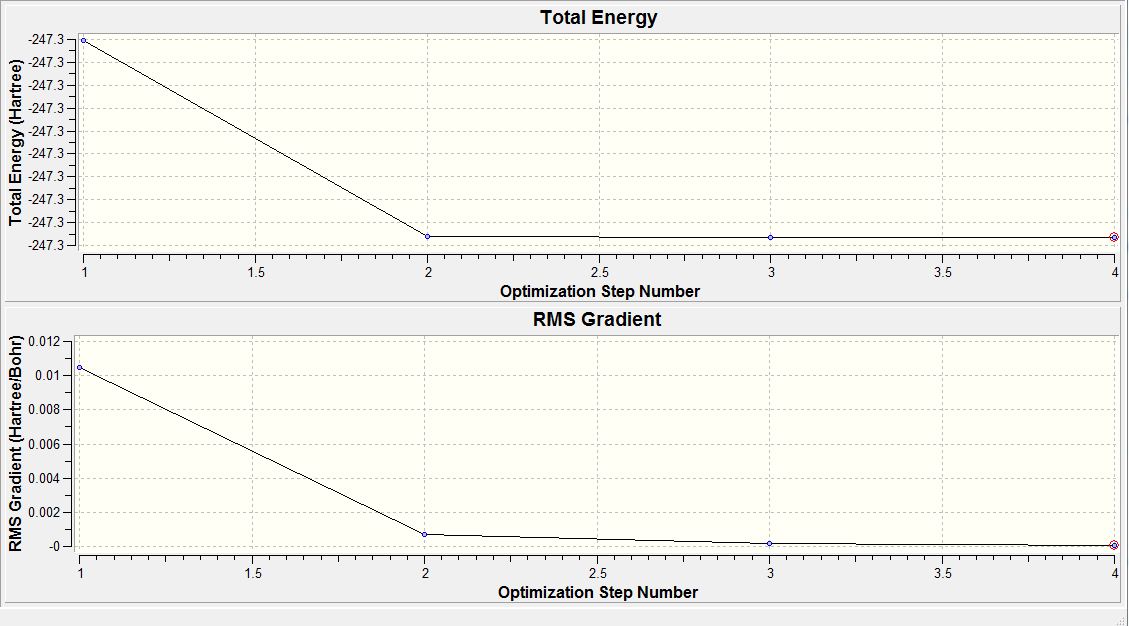
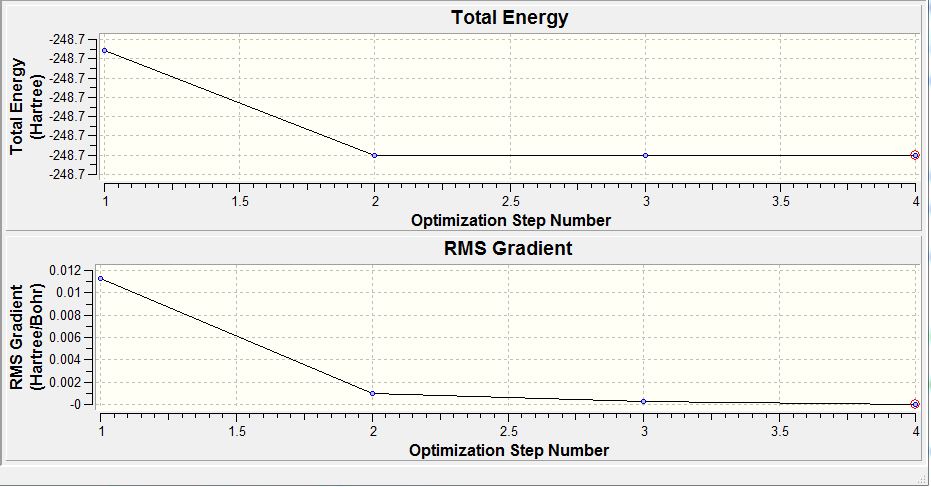
Overall it is observed that the second more accurate 6-31G basis set brought about a lowering of the total energy of the individual molecules. It also resulting in the RMS gradient to be within the same range of being lesser than 0.001 a.u. which was indicative of an almost horizontal plot as seen from the progress of optimisations above. This was indicative of the derivative forces had converged at the present threshold level and was an indication for the completion of the optimisation. This allowed the optimised molecules to be further analysis via vibrational analysis which upon analysis of the 'low' frequencies will further complement or contradict the claimed successful optimisation. The convergence of the force derivatives against present threshold was further checked with all the respective log files.
There is a difference in the point group symmetries in the table above as compared to that given in the introduction. Analysis of each individual symmetry element was indicative that the programme had assigned the incorrect point group where benzene was not C1 and instead D6h while boratabenzene anion and pyridinium cations are both not C1 but instead C2v. This would be expected to occur as the benzene molecule in the gaussview is distorted upon optimisation resulting in the deviation from the expected point group. However, for the vibration-based analysis they will be subjected to the symmetry elements of the D6h and C2v point groups respectively.
Bond Analysis
| Bond Length/Å | |||||||
|---|---|---|---|---|---|---|---|
| Bond | Calculated- C6H6 | Literature - C6H6 | Calculated-C5BH6- | Literature C5BH6- [30] | Calculated-C5NH6+ | Literature C5NH6+[31] | |
| X1-H | 1.09 | 1.08 | 1.22 | 1.02 | 1.017 | 1.052 | |
| X1-C2 | 1.40 | 1.40 | 1.541 | 1.453 | 1.352 | 1.351 | |
| C2-C3 | 1.40 | 1.40 | 1.399 | 1.389 | 1.383 | 1.381 | |
| C3-C4 | 1.40 | 1.40 | 1.405 | 1.388 | 1.399 | 1.396 | |
| C4-C5 | 1.40 | 1.40 | 1.405 | 1.380 | 1.399 | 1.396 | |
| C5-C6 | 1.40 | 1.40 | 1.399 | 1.410 | 1.383 | 1.381 | |
| C6-X1 | 1.40 | 1.40 | 1.541 | 1.481 | 1.352 | 1.351 | |
A comparison of the X(heteroatom)-C bond and C-C bond lengths were carried out. Comparisons made against literature values for all three analogues showed that the calculated values had minimal deviation from the literature values. Thus the geometry and structure of the computationally calculated analogues were highly reliable. Comparing the X-H bond across the table, it is seen that the nitrogen analogue has the smallest N-H bond followed by benzene and lastly the boron. Thus the more electronegative X group used results in the X-H bond to be shorter which can be accounted for due to the electronegative character of the X atom.
Comparing the C-C bond lengths it seen that the use of the N atom results in the ring to contract slightly by 0.01 angstroms. This is a very small distance to be be making any conclusions. It is however anticipated that there should not be much changes in the N analogue benzene apart from inductive effects as the only available p-oribtal lone pair is not localised in the N-H bond. Thus it is unable to have resonanace type interactions with the π* orbitals of the ring. Thus, minimal changes the the C-C bonds is expected. However, being the more electronegative atom it will have inductive electron withdrawing. But for the Boron which has the similar situation of the empty orbital now localised in the B-H bond it is more electropositive in nature and should have more inductive electron donation into the ring and would be expected to slightly increase the C-C bond since donation of electrons into the π* orbital inductively decreases the energy of the π bond which causes a slight lengthening of the bond.
Population Analysis
The population analysis will be carried out as two seperate segments where the first will be an Natural Bond Order and Mullikien charge analysis followed by a Molecular Orbital (MO) analysis. The analysis will be used to justify and compare the electronic distribution within the different benzene analogues.
Natural Bond Order & Mullikien Charges Analysis
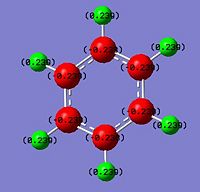
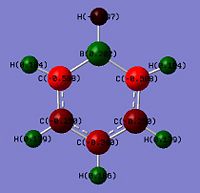
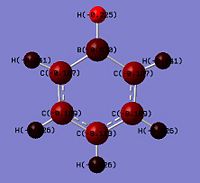
The NBO analysis carried out is expected to help rationalise the change in charge density throughout the molecule. The green regions indicate high positive charges while the red regions indicate high negative charges. The more negative the charge the greater the electron density about the region. The mullikien charge density map is just another way of determining the charge density allocations within the moelcule.
 |
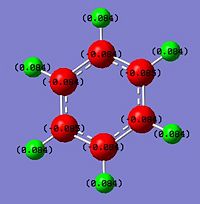 |
The carbon framework of the benzene ring is in red as expected with a numerical value of -0.238 since it accounts for the delocalised pi-electron could expected from an aromatic compound. Having the delocalised centre would explain the electron deficient nature of the protons which are yellow and a positive value of 0.239. However, based on the bond lengths seen earlier, benzene has an equal electron distribution so all the carbons have the same electron density and so do all the hydrogens relative to each other. However it is expected to change for the other two analogues which introduces the heteroatom of a varying electronegativity.
 |
 |
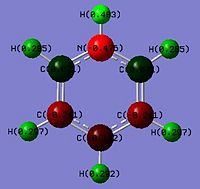
Looking at the NBO charges, replacement of the C-H with B-H where boron being from G(III) is much more electropositive. This is seen from the difference in charges where a significant change is magnitude relative to benzene from -0.235 to 0.202 is observed. This shows an inversion in the polarity where the X atom in boratabenzene is electron deficient. Boron being less electron withdrawing is seen by comparing the C-H against the N-H where the charge density on the hydrogen decreases from 0.235 in benzene to -0.097 in boratabenzene. This shows that the hydrogen is no longer electron deficient and would less readily dissociate as H+. Thus explaining why borata benzene is less acidic than benzene. The effects of being electropositive are inductive and resonance based. This is seen in the 2 adjecent carbons (position 2 and 6) which has a charge of -0.588 whereas benzene carbons have it as -0.235. The two next furthest (position 3 and 5) have it as -0.250 which is half the magnitude of position 2 and 6. This shows that these 2 carbons being 2 bonds away from the boron would be less electron dense as it experiences less of the 'electon-pushing' effects of the boron. The furthest carbon (position 4) has a value of -0.340. This shows the furthest has the second most electon density in the ring. Thus the un-equal electron density of the system can be rationalised by the scheme below. As electron delocalisation into the ring is not as significant, the C-H bond hydrogen would be less electron deficient of 0.184 (smaller positive value) that the benzene hydrogens.
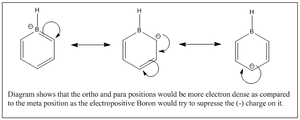
 |
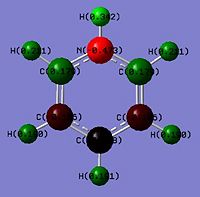 |
Again comparing the charges within the pyridinium analogue, the nitrogen(Group V) being more electron withdrawing has a larger negative magnitude of -0.475 as compared to benzene which has -0.239. This fits the logic of nitrogen being more electron withdrawing than carbon. This would however similar to boratabenzene result in unequal electron distribution within the benzene analogue. The inductive effects result in the N-H hydrogen to be strongly electron deficient of 0.483 as compared to 0.239 in benzene. The two adjecent carbons are a positive magnitude of 0.071 as compared to the other two frame works which are negative. This shows that the ortho positions are electron deficient and more deficient that position 4 due to added resonance + inductive effects (Diagram 43). The meta position would not be as electron deficient as it is less influenced by inductive effects and less by resonance so a negative value.
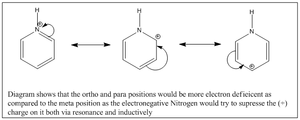
Molecular Orbital Analysis
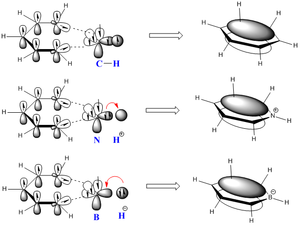
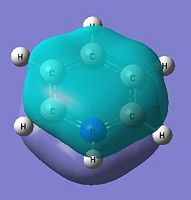
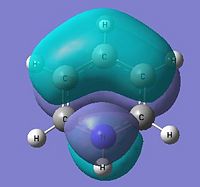
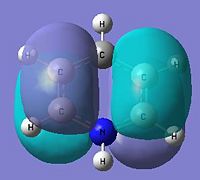
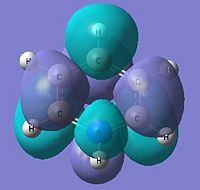
The cloud representation shows the different type of analogues formed where the nitrogen analogue being electronegative would be inductively withdrawing and would have an electron deficient nitrogen centre. Inversely, the electropositive boron results in an inductive electron pushing into the carbon framework. Benzene having the same atoms within the framework would have equal electron distribution.
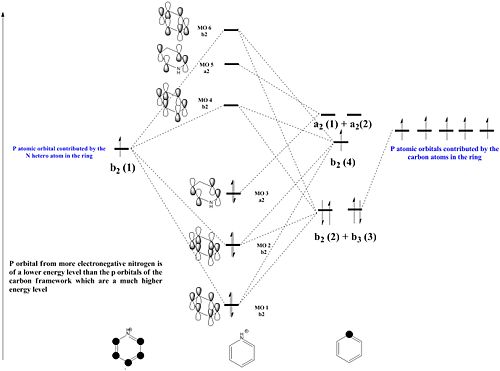
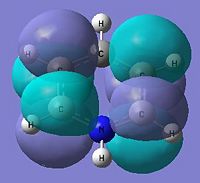
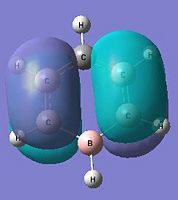
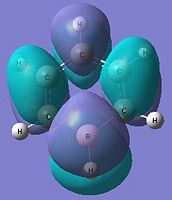
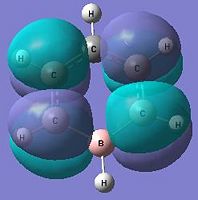
The below molecular diagrams shows the occupancy of the 3 bonding orbitals and to be specific in the analysis, only the Pi molecular oribital are looked at. Thus these specific 6 molecular orbitals will be looked into through all 3 analogues and their respective energy levels will be compared and rationalised
Approach towards B and N analogues
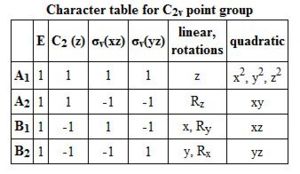
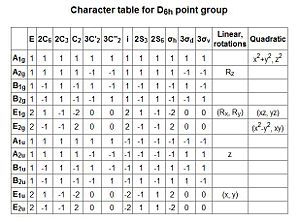
Both the boron and nitrogen analogues of benzene have the same point group (C2v) and so would be expected to have the same type of molecular orbitals with varying energy levels. The molecular orbitals would be of varying energy levels as the heteroatoms are of different electro-negativities (shown above in NBO analysis). The Character table will be used to determine the irreducible representations of the p-orbtals in the basis set. Subsequently the rotation and projection operators are used to determine how each other is expected to look like. As the p-orbitals are delocalised to form the Pi-System and there being a total of 21 occupied molecular orbitals, only the p-orbitals will be taken into account to compare the LCAO approach against the computationally derived orbitals. This will be done by using the rotation and projection operators to determine how the 6 p-orbitals 'look' like.
 |
 |
 |
 |
 |
 |
 |
 |
 |
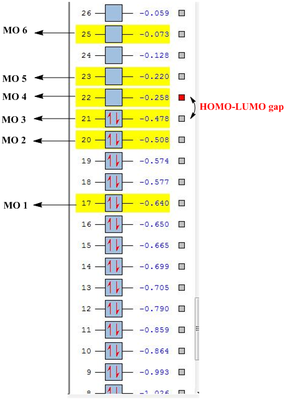
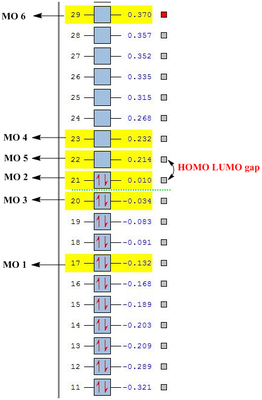
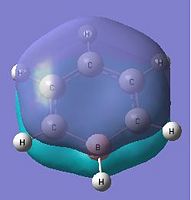
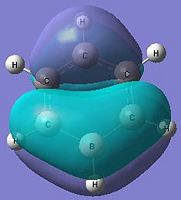
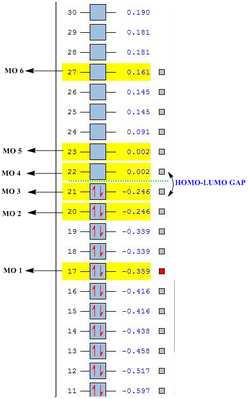
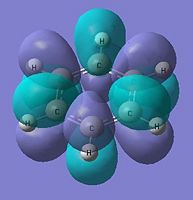
As stated before, only the specific orbitals that correspond similarly to the orbitals via LCAO are considered as they are the Pi-oribtals. Diagram 47 shows that the HOMO-LUMO orbitals have the orbital phases as expected in the LCAO approach. However, Mo1 and MO 6 are not in direct sequence with the other orbitals (highlighted) and is because those in between are possibly due to other orbital mixings which will not be considered.
 |
 |
 |
 |
 |
 |
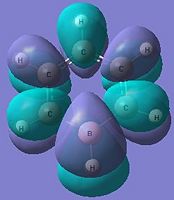 |
The comparison of the molecular orbitals is similar to that seen in the nitrogen analogue where the distinct difference is with the energy levels of the specific molecular orbitals that will be compared subsequently.
Approach towards Benzene
 |
 |
 |
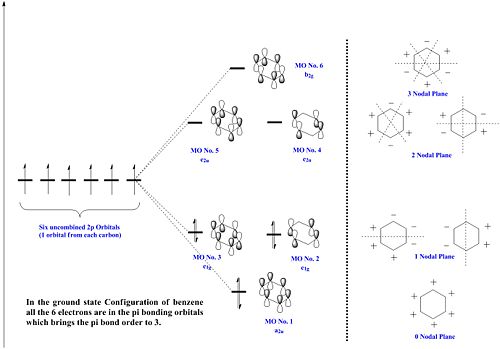
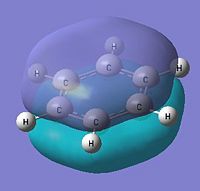
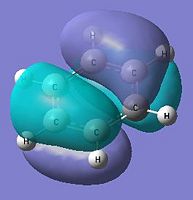
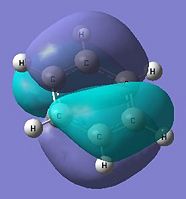
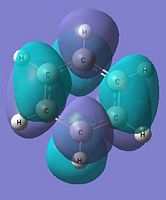
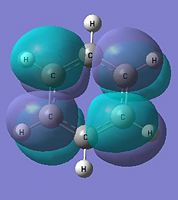
The diagram shows the equal splitting of the molecular orbitals which is expected since all the atoms of the 6-membered framework are carbons and of the same electronegativity. It is also seen with greater out of phase interactions there is a greater number of nodal planes and as such there is more destabilising interactions resulting in a higher energy level molecular orbital
 |
 |
 |
 |
 |
 |
Comparing the influence of the Heterogroup
| Molecular Orbital | C6H6(a.u.) | C5BH6-(a.u.) | C5H6N+(a.u.) |
|---|---|---|---|
| MO 1 | -0.359 | -0.132 | -0.640 |
| MO 2 | -0.246 | 0.010 | -0.508 |
| MO 3 | -0.246 | -0.034 | -0.478 |
| MO 4 | 0.002 | 0.232 | -0.258 |
| MO 5 | 0.002 | 0.214 | -0.220 |
| MO 6 | 0.161 | 0.370 | -0.073 |
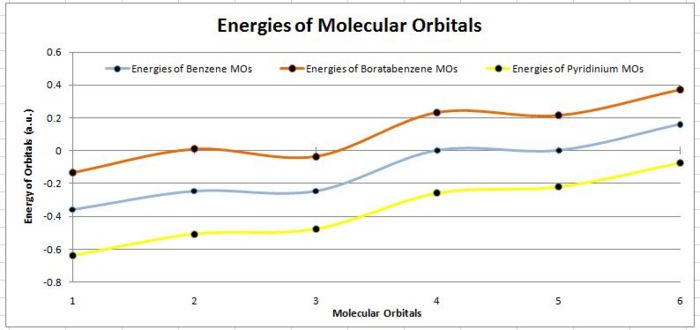
As seen from the above tables and diagrams, it can be seen that for all there analogues the expected orbital phases are highly similar to the calculated molecular orbitals. However there is a difference in the HOMO-LUMO gap for a three analogues and is due to the difference of the R atom substituted into the ring. The benzene has a difference between MO 3 and MO 4 of 0.248 a.u. while the Boron analogue has a difference between MO 2 and MO 5 of 0.224 a.u. which is a slightly smaller gap and finally the nitrogen analogue has the gap between MO 3 and MO 4 of 0.220 a.u. It would show that the nitrogen analogue as expected is the better pi acceptor due to the electronegative nature of nitrogen.
Comparisons of the plots in the graph would show that the Nitrogen analogue being more electronegative will be lower in energy level and thus having the lowest lumo explains it higher pKa for the deprotonation as compared to the other analogues. Similarly, boron being electro positive will have the higher energy p orbitals that result in higher energy pi-orbitals. This would make the LUMO energetically less accessible and thus would have a much higher pKa and is instead a much better base with the higher more readily available HOMO orbital.
Vibrational Analysis
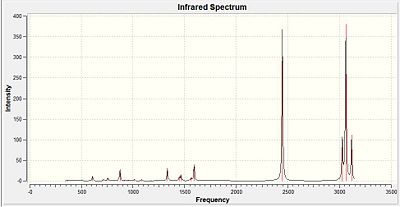
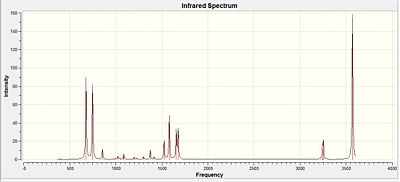
Benzene vibrational analysis Log File Boratabenzene vibrational analysis Log File Pyridinium vibrational analysis Log File
 |
 |
 |
| Type of Stretch | Literature value (cm-1)[32] | Calculated Value | Diagramatic representation | |||
|---|---|---|---|---|---|---|
| Ring Deformation | 392 | 392.5 |
| |||
| Ring Deformation | 606 | 620 |
| |||
| CH Bend | 661 | 676 |
| |||
| Ring Deformation | 859 | 855 |
| |||
| CH Bend | 969,990 | 992 |
| |||
| CH Bend + Ring Deformation | 1048 | 1023, 1048 |
| |||
| CH-IP bend | 1165 | 1199 |
| |||
| CH bend | 1254 | 1229 |
| |||
| Ring Stetch | 1321,1375 | 1374 |
| |||
| Ring Deformation | 1474,1530 | 1416,1524 |
| |||
| C-H stretch | 3112,3129, 3139,3141 | 3243, 3256 |
| |||
| N-H stretch | 3451 | 3569 |
|
From the table above it can be seen that the calculated results are in good agreement with the literature values and analysis of all 3 log files show that the optimisation did lead to a positive turning point as explained in earlier sections. Thus the vibrational analysis complemented on the successive optimisation carried out for all three analogues. But do to lack of time vibrational analysis was only carried out for the nitrogen analogue. It was also not the 'focused' on method of analysis as the three analogues have different atoms present where the main analysis factor was the MO analysis carried out.
Conclusion
It has been justified and rationalised why the nitrogen analogue is more proton labile than the other two. Also, the influence of electronegativity into an aromatic ring has been analysed.
Fisty 13:13, 13 March 2011 (UTC)
References
- ↑ Fourier transform infrared spectroscopy of the BH, v3 band,Kentarou Kawaguchi, J. Chem. Phys., Vol. 96, No. 5,1 March 1992
- ↑ http://www.huntresearchgroup.org.uk/teaching/teaching_comp_lab_year3/6_freq_analysis.html
- ↑ http://www.huntresearchgroup.org.uk/teaching/teaching_comp_lab_year3/6_freq_analysis.html
- ↑ http://www.huntresearchgroup.org.uk/teaching/teaching_comp_lab_year3/6_freq_analysis.html
- ↑ http://www.webqc.org/symmetrypointgroup-d3h.html
- ↑ K. Kawaguchi, J. E. Butler, C. Yamada, S. H. Bauer, T. Minowa, H. Kanamori, and E. Hirota, J. Chem. Phys. 87,243s ( 1987).
- ↑ Fourier transform infrared spectroscopy of the BH, v3 band,Kentarou Kawaguchi, J. Chem. Phys., Vol. 96, No. 5,1 March 1992
- ↑ http://pubs.acs.org/doi/abs/10.1021/jp011945l
- ↑ J.Blixt, J.Glaser, J.Mink, I.Perrson, P.Perrson and M. Sandstrom, J. Am. Chem. Soc., 1995, 117, pp 5089-5104:DOI:10.1021/ja00123a011
- ↑ http://www.webqc.org/symmetrypointgroup-d3h.html
- ↑ pubs.acs.org/doi/abs/10.1021/ic50122a045
- ↑ Glossary of Terms used in Physical Organic Chemistry (IUPAC Recommendations 1994), PAC, 1994, 66, pg 1077:DOI:10.1351/pac199466051007
- ↑ http://pubs.acs.org/doi/pdf/10.1021/ed079p1249
- ↑ http://www.huntresearchgroup.org.uk/teaching/teaching_comp_lab_year3/10b_MoC4L2_opt.html
- ↑ http://www.gaussian.com/g_tech/g_ur/m_basis_sets.htm
- ↑ P. J. Hay and W. R. Wadt, “Ab initio effective core potentials for molecular calculations - potentials for K to Au including the outermost core orbitals,” J. Chem. Phys., 82 (1985) 299-310.
- ↑ G. Hogarth, T. Norman, Inorganica Chemica Acta 254 (1997) 167 - 171.
- ↑ G. Hogarth, T. Norman, Inorganica Chemica Acta 254 (1997) 167 - 171.
- ↑ F.A. Cotton, D.J. Darensbourg, S. Klein and B.W.S. Kolthammer. Inorg. Chem. 21 (1982), p. 294
- ↑ G. Hogarth, T. Norman, Inorganica Chemica Acta 254 (1997) 167 - 171.
- ↑ F.A. Cotton, D.J. Darensbourg, S. Klein and B.W.S. Kolthammer. Inorg. Chem. 21 (1982), p. 294
- ↑ ELmer C. Alyea and Shuquan Song, Inorg. Chem., 1995, 34, 3864-3873
- ↑ ELmer C. Alyea and Shuquan Song, Inorg. Chem., 1995, 34, 3864-3873
- ↑ ELmer C. Alyea and Shuquan Song, Inorg. Chem., 1995, 34, 3864-3873
- ↑ ELmer C. Alyea and Shuquan Song, Inorg. Chem., 1995, 34, 3864-3873
- ↑ W.Hieber, J.Peterhans, Z. Naturforsch., 1959, 14b, pg 462
- ↑ W.Hieber, J.Peterhans, Z. Naturforsch., 1959, 14b, pg 462
- ↑ E. P. Serjeant and B. Dempsey (eds.), Ionization Constants of Organic Acids in Solution, IUPAC Chemical Data Series No. 23, Pergamon Press, Oxford, UK, 1979
- ↑ 1-Borabarrelene Derivatives via Diels-Alder Additions to Borabenzenes Thomas K. Wood, Warren E. Piers, Brian A. Keay, and Masood Parvez Org. Lett.; 2006; 8(13) pp 2875 - 2878; (Letter) doi:10.1021/ol061201w
- ↑ http://pubs.acs.org/doi/abs/10.1021/ja00137a030
- ↑ http://pubs.acs.org/doi/pdfplus/10.1021/jo051354h
- ↑ http://pubs.acs.org/doi/pdf/10.1021/jp013080h

