
Most linked-to files
Showing below up to 50 results in range #4,301 to #4,350.
-
-
-
-
-
-
-

-
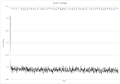
Figure 4 - Plot showing the total energy of the system as a function of time for timestep 0.001 experiment.png Used on 2 pages
File missing
-
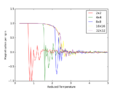
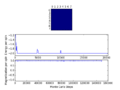
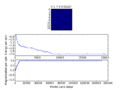
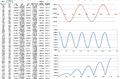
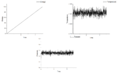
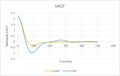
 Figure 4 Energy of Classical Harmonic Oscillator as a function of time (timestep=0.2).PNG Used on 2 pages
971 × 340; 26 KB
-

-
-
Figure 5 - Plot showing the temperature of the system as a function of time for timestep 0.001 experiment.png Used on 2 pages
File missing
-
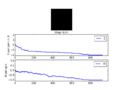
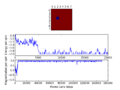
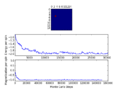
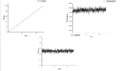
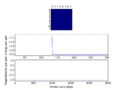
 Figure 5 Energy of Classical Harmonic Oscillator as a function of time (timestep=0.3).PNG Used on 2 pages
973 × 331; 36 KB
-

-
Figure 6 - Plot showing the pressure as a function of time for timestep 0.001 experiment.png Used on 2 pages
File missing
-

-

-
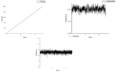
Figure 7 - A plot of total energy as a function of time with different timesteps.png Used on 2 pages
File missing
-

-
-
Figure 9 - A plot showing the heat capacity as a function of temperature at 2 different densities.png Used on 2 pages
File missing
-
-

-
-
Figure illustrating the coordination number = 12 for the first nearest neighbour atom in FCC.png Used on 2 pages
File missing
-
Figure illustrating the coordination number = 24 for the third nearest neighbour atom in FCC.png Used on 2 pages
File missing
-
Figure illustrating the coordination number = 6 for 2nd nearest neighbour atom in FCC.png Used on 2 pages
File missing
-

-

-
-
-
-
-
-
-
-
-
-

-
-
-
-
-
-
-
-
-


.PNG)
.PNG)