Uploads by Am12618
Appearance
This special page shows all uploaded files.
| Date | Name | Thumbnail | Size | Description | Versions |
|---|---|---|---|---|---|
| 16:00, 13 May 2020 | AM Dynamics Calculation with r1 = rts+1 pm, r2 = rts and p1 = p2 = 0.png (file) |  |
27 KB | 1 | |
| 15:58, 13 May 2020 | AM. MEP calculation with r1 = rts+1 pm, r2 = rts and p1 = p2 = 0.png (file) |  |
26 KB | 1 | |
| 15:30, 13 May 2020 | Contour Plot of the best estimate of the transition state position(r1=r2=90.775 pm).png (file) |  |
157 KB | 1 | |
| 16:17, 15 March 2019 | HOMO LUMO AM.PNG (file) | 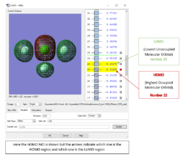 |
144 KB | 1 | |
| 15:34, 15 March 2019 | Molecule labels.PNG (file) | 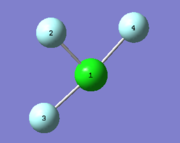 |
22 KB | 1 | |
| 10:46, 15 March 2019 | 2AM MO 15.PNG (file) | 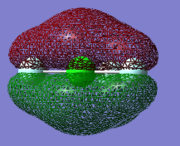 |
59 KB | 1 | |
| 10:46, 15 March 2019 | 2AM MO 13.PNG (file) | 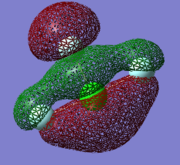 |
71 KB | 1 | |
| 10:46, 15 March 2019 | 2AM MO 10.PNG (file) | 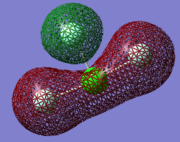 |
67 KB | 1 | |
| 10:45, 15 March 2019 | 2AM MO 9.PNG (file) | 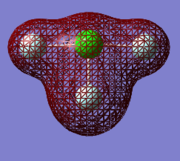 |
58 KB | 1 | |
| 10:14, 15 March 2019 | AM MO 15.PNG (file) | 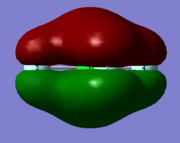 |
73 KB | 1 | |
| 10:00, 15 March 2019 | AM MO 13.PNG (file) |  |
84 KB | 1 | |
| 09:55, 15 March 2019 | AM MO 10.PNG (file) | 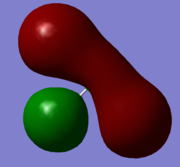 |
64 KB | 1 | |
| 09:50, 15 March 2019 | AM MO 9.PNG (file) | 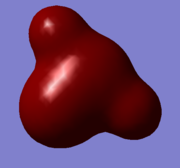 |
74 KB | 1 | |
| 09:48, 15 March 2019 | AM MO 1.PNG (file) | 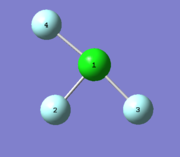 |
34 KB | 1 | |
| 08:52, 15 March 2019 | AM2 Display Vibrations ClF3.PNG (file) |  |
15 KB | 1 | |
| 08:51, 15 March 2019 | AM2 Display Vibrations H2.PNG (file) |  |
13 KB | 1 | |
| 08:51, 15 March 2019 | AM2 Display Vibrations N2.PNG (file) | 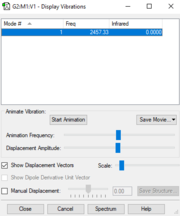 |
13 KB | 1 | |
| 08:50, 15 March 2019 | AM2 Display Vibrations NH3.PNG (file) | 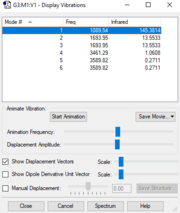 |
15 KB | 1 | |
| 08:46, 15 March 2019 | Charge distribution1.PNG (file) | 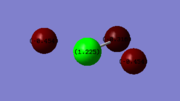 |
15 KB | 1 | |
| 08:45, 15 March 2019 | 2charge distribution H2.PNG (file) | 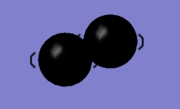 |
8 KB | 1 | |
| 08:41, 15 March 2019 | 2Charge distribution on N2 molecule am.PNG (file) |  |
27 KB | Charge on nitrogen molecule | 1 |
| 08:39, 15 March 2019 | 2Charge distribution on NH3 molecule am12618.PNG (file) |  |
24 KB | 1 | |
| 17:19, 14 March 2019 | AM Display Vibrations ClF3.PNG (file) | 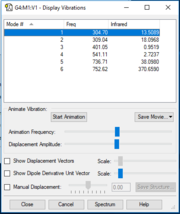 |
18 KB | 1 | |
| 17:17, 14 March 2019 | AM Display Vibrations H2.PNG (file) | 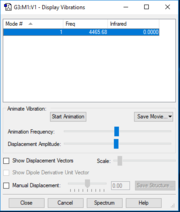 |
16 KB | 1 | |
| 17:17, 14 March 2019 | AM Display vibrations N2.PNG (file) | 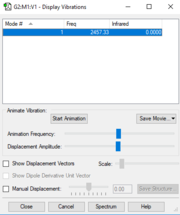 |
13 KB | 1 | |
| 17:15, 14 March 2019 | AM Display Vibrations NH3.PNG (file) | 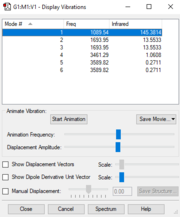 |
15 KB | 1 | |
| 16:35, 14 March 2019 | ATHINAMASOURA2 AM12618 PHUNT CLF3 OPTF POP.LOG (file) | 602 KB | 1 | ||
| 16:03, 14 March 2019 | Transition Metal complex YECMOL withbonddistance.PNG (file) | 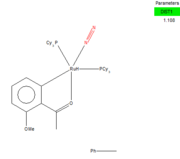 |
5 KB | 1 | |
| 15:41, 14 March 2019 | AthinaMasoura am12618 PHunt h2 optf pop.LOG (file) | 95 KB | 2 | ||
| 15:34, 14 March 2019 | AthinaMasoura am12618 PHunt N2 optf pop.LOG (file) | 196 KB | Reverted to version as of 15:24, 14 March 2019 | 3 | |
| 12:19, 14 March 2019 | Charge distribution2.PNG (file) | 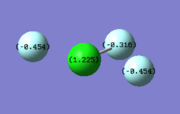 |
19 KB | 1 | |
| 12:09, 14 March 2019 | Vibrational mode clf3 6.PNG (file) | 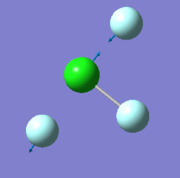 |
19 KB | 1 | |
| 12:09, 14 March 2019 | Vibrational mode clf3 5.PNG (file) | 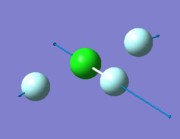 |
19 KB | 1 | |
| 12:09, 14 March 2019 | Vibrational mode clf3 4.PNG (file) | 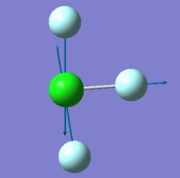 |
23 KB | 1 | |
| 12:08, 14 March 2019 | Vibrational mode clf3 3.PNG (file) | 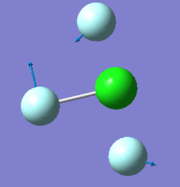 |
24 KB | 1 | |
| 12:08, 14 March 2019 | Vibrational mode clf3 2.PNG (file) | 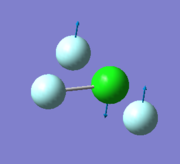 |
26 KB | 1 | |
| 12:06, 14 March 2019 | Vibrational mode clf3 1.PNG (file) |  |
26 KB | 1 | |
| 10:38, 14 March 2019 | Transition metal complex.PNG (file) | 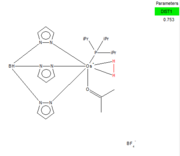 |
6 KB | 1 | |
| 09:47, 14 March 2019 | Transition Metal complex YECMOL.PNG (file) | 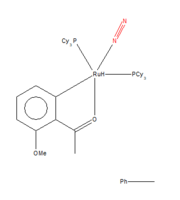 |
4 KB | 1 | |
| 09:43, 14 March 2019 | Mono-metallic TM complex that coordinates N2 YECMOL.cqs (file) | 232 KB | Transition Metal complex with N2 Name: YECMOL | 1 | |
| 09:23, 14 March 2019 | Charge distribution H2.PNG (file) | 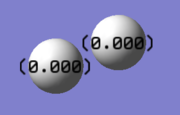 |
20 KB | 1 | |
| 09:19, 14 March 2019 | Vibrational Mode of H2.PNG (file) |  |
19 KB | 1 | |
| 08:58, 14 March 2019 | ATHINAMASOURA AM12618 PHUNT NH3 OPTF POP.LOG (file) | 228 KB | 1 | ||
| 08:36, 14 March 2019 | Charge distribution on N2 molecule am.PNG (file) |  |
9 KB | Charge distribution on nitrogen molecule. The colour black indicates the 0 charge on each nitrogen atom | 1 |
| 08:22, 14 March 2019 | N2 vibrational mode.PNG (file) |  |
22 KB | N2 vibrational mode | 1 |
| 16:16, 13 March 2019 | Charge distribution on NH3 molecule am12618.PNG (file) |  |
27 KB | 1 | |
| 16:00, 13 March 2019 | 6.2.PNG (file) |  |
27 KB | Vibrational mode 6 of NH3 molecule | 1 |
| 15:57, 13 March 2019 | 4.2.PNG (file) | 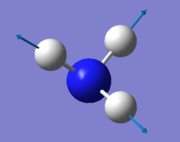 |
29 KB | Vibrational mode 4 of the NH3 molecule | 1 |
| 15:54, 13 March 2019 | 3.2.PNG (file) |  |
30 KB | Vibrational mode 3 of NH3 | 1 |
| 14:18, 13 March 2019 | AthinaMasoura am12618 PHunt nh3 optf pop.gjf (file) | 457 bytes | 1 |
