
Uploads by Tna08
This special page shows all uploaded files.
| Date | Name | Thumbnail | Size | Description | Versions |
|---|---|---|---|---|---|
| 21:29, 3 March 2011 | Picture1timmyboy.png (file) | 10 KB | 1 | ||
| 21:33, 3 March 2011 | Timmyboy2.mol (file) | 2 KB | 1 | ||
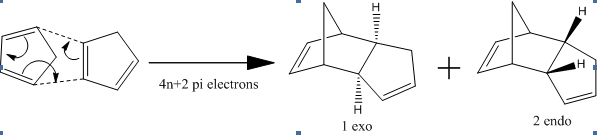
| 21:56, 3 March 2011 | Picture 1timarbab.jpg (file) | 22 KB | Fig. 1: The mechanism and two products | 1 | |
| 22:21, 3 March 2011 | Picture 2 tables for 1 2.jpg (file) |  |
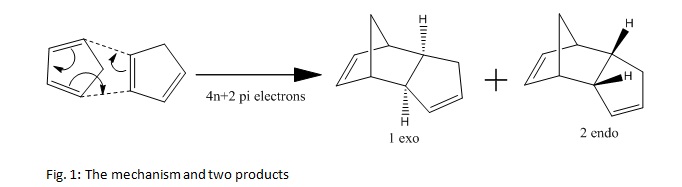
61 KB | Fig. 2: The tables showing the results from the MM2 energy minimisation. 1 is on the left and 2 is on the right. | 1 |
| 23:27, 3 March 2011 | Picture 3 molecules 1 and 2timarbab.jpg (file) |  |
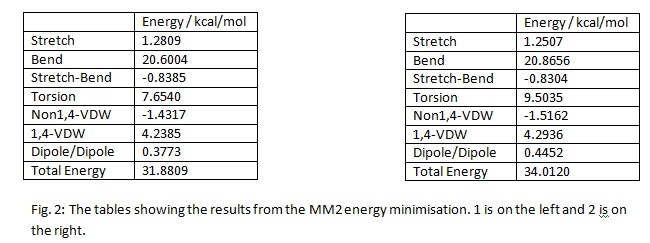
58 KB | Fig. 3: The 2-D and 3-D representations, created by ChemBio 3D Ultra 12, after the MM2 optimisation. Exo (1) form is on the left and the endo (2). | 1 |
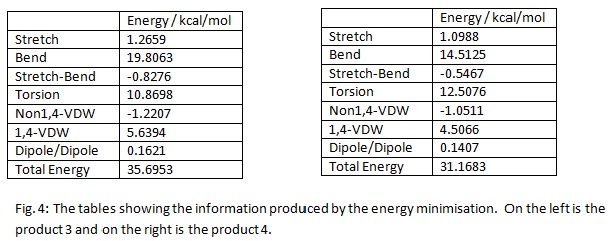
| 23:29, 3 March 2011 | Picture 4 tables for 3 and 4.jpg (file) |  |
64 KB | Fig. 4: The tables showing the information produced by the energy minimisation. On the left is the product 3 and on the right is the product 4. | 1 |
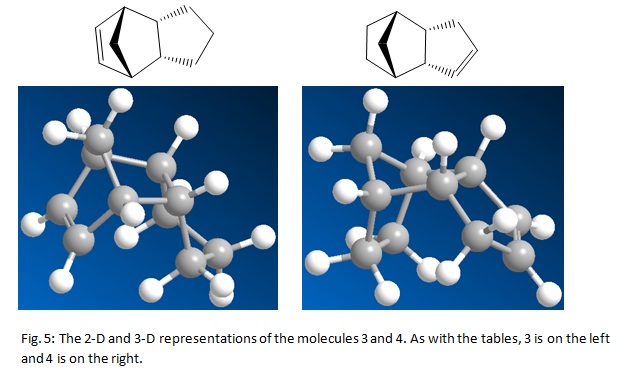
| 23:30, 3 March 2011 | Picture 5 molecules 3 and 4.jpg (file) |  |
64 KB | Fig. 5: The 2-D and 3-D representations of the molecules 3 and 4. As with the tables, 3 is on the left and 4 is on the right. | 1 |
| 01:20, 4 March 2011 | Picture 6 Mechanism of 5.jpg (file) |  |
22 KB | Fig. 6: The mechanism of prolinol reacting with MgMeI. | 1 |
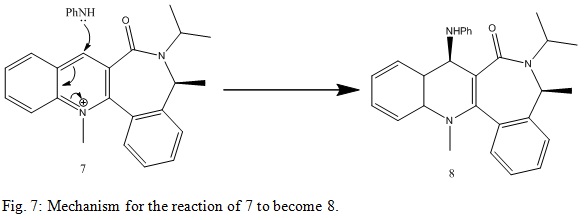
| 01:21, 4 March 2011 | Picture 7 Mechanism of 7.jpg (file) |  |
23 KB | Fig. 7: Mechanism for the reaction of 7 to become 8. | 1 |
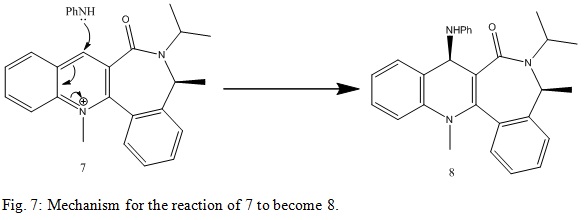
| 01:31, 4 March 2011 | Picture 7 Mechanism of 7version2.jpg (file) |  |
24 KB | Fig. 7: Mechanism for the reaction of 7 to become 8. | 1 |
| 01:44, 4 March 2011 | 5 final versionmol.mol (file) | 3 KB | Jmol for 5 | 1 | |
| 01:45, 4 March 2011 | 6 mol.mol (file) | 3 KB | Jmol of 6 | 1 | |
| 01:46, 4 March 2011 | 7 mol.mol (file) | 4 KB | Jmol of 7 | 1 | |
| 01:46, 4 March 2011 | 8 mol.mol (file) | 6 KB | Jmol of 8 | 1 | |
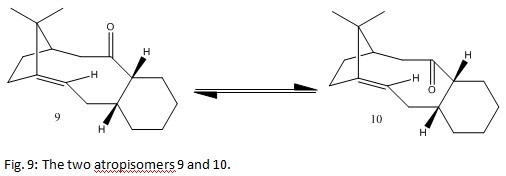
| 02:10, 4 March 2011 | Picture 9 atropisomers 9 and 10.jpg (file) |  |
17 KB | Fig. 9: The two atropisomers 9 and 10. | 1 |
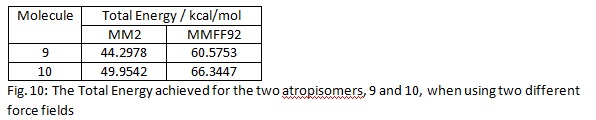
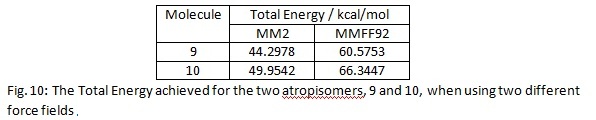
| 02:39, 4 March 2011 | Picture 10 9 and 10 energy table.jpg (file) | 24 KB | Fig. 10: The Total Energy achieved for the two atropisomers, 9 and 10, when using two different force fields. | 1 | |
| 02:41, 4 March 2011 | Picture 10 9 and 10 energy table2.jpg (file) | 23 KB | Fig. 10: The Total Energy achieved for the two atropisomers, 9 and 10, when using two different force fields. | 1 | |
| 02:44, 4 March 2011 | Picture 9 atropisomers 9 and 102.jpg (file) |  |
16 KB | Fig. 9: The two atropisomers 9 and 10. | 1 |
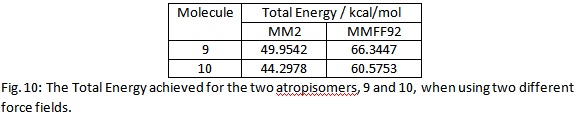
| 14:32, 4 March 2011 | Picture 10 9 and 10 energy table final.jpg (file) | 25 KB | Fig. 10: The Total Energy achieved for the two atropisomers, 9 and 10, when using two different force fields. | 1 | |
| 14:56, 4 March 2011 | 10 alkane mol.mol (file) | 4 KB | Fig. 12: The alkane related to molecule 10. | 1 | |
| 16:36, 4 March 2011 | 12 mol.mol (file) | 2 KB | Fig. 13: A Jmol of molecule 12. | 1 | |
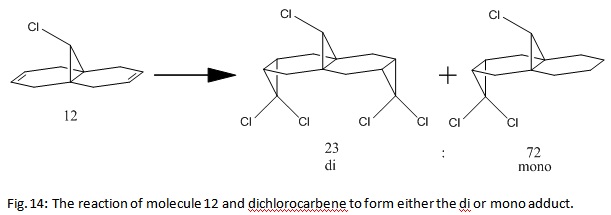
| 16:38, 4 March 2011 | Picture 14 reaction of 12 and CCl2.jpg (file) |  |
24 KB | Fig. 14: The reaction of molecule 12 and dichlorocarbene to form either the di or mono adduct. | 1 |
| 16:39, 4 March 2011 | Picture 15 MOs of 12 from PM6.jpg (file) |  |
125 KB | Fig. 15: The molecular orbitals obtained using PM6. The top row is, from left to right, HOMO-2, HOMO-1 and HOMO. The bottom row is, from left to right, LUMO, LUMO+1 and LUMO+2. | 1 |
| 19:07, 4 March 2011 | Picture 14 reaction of 12 and CCl2 2.jpg (file) |  |
23 KB | Fig. 14: The reaction of 12 and dichlorocarbene to form the di or mono adduct. | 1 |
| 19:10, 4 March 2011 | Picture 15 MOs of 12 from PM6 2.jpg (file) |  |
120 KB | Fig. 14: The molecular orbitals obtained using PM6. The top row is, from left to right, HOMO-2, HOMO-1 and HOMO. The bottom row is, from left to right, LUMO, LUMO+1 and LUMO+2. | 1 |
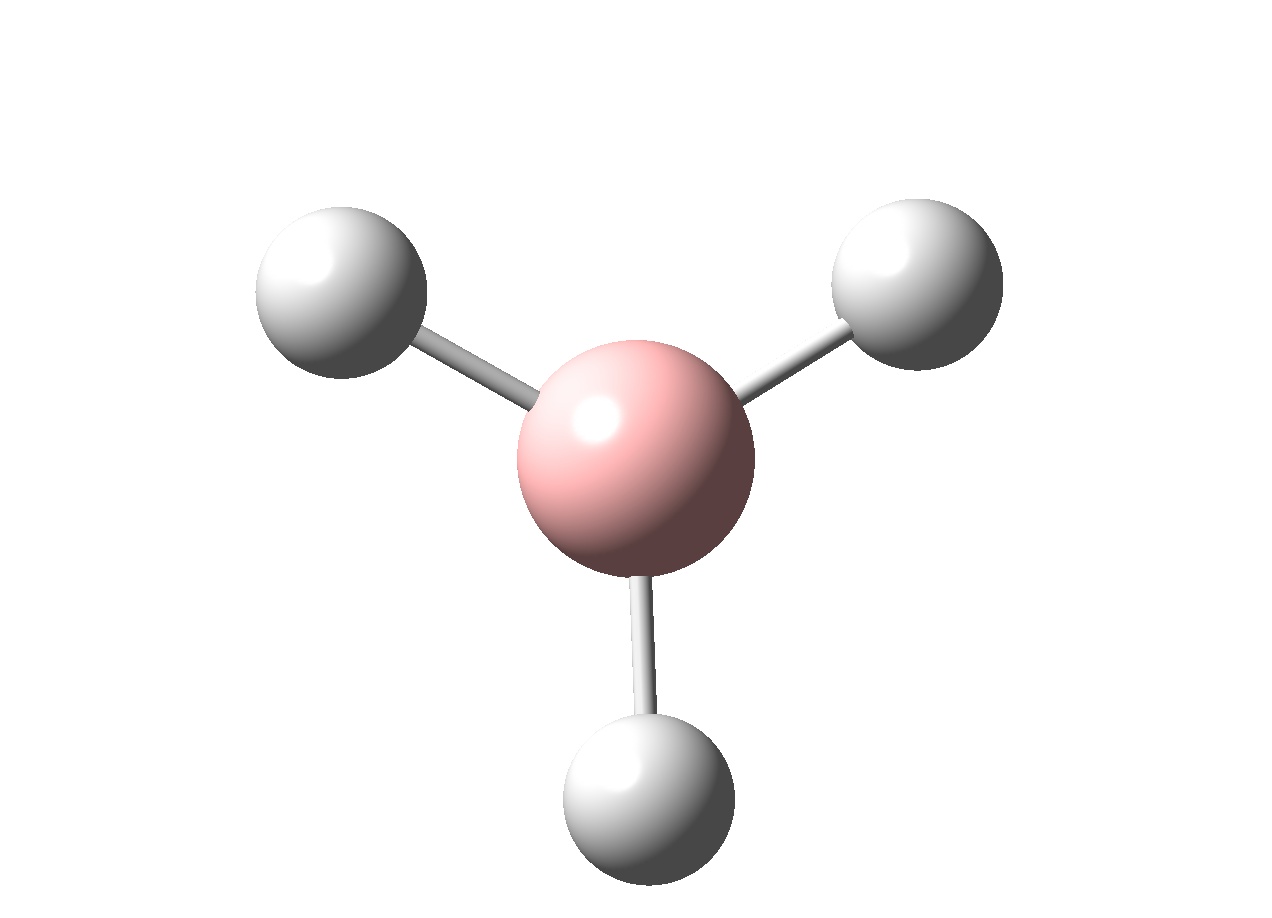
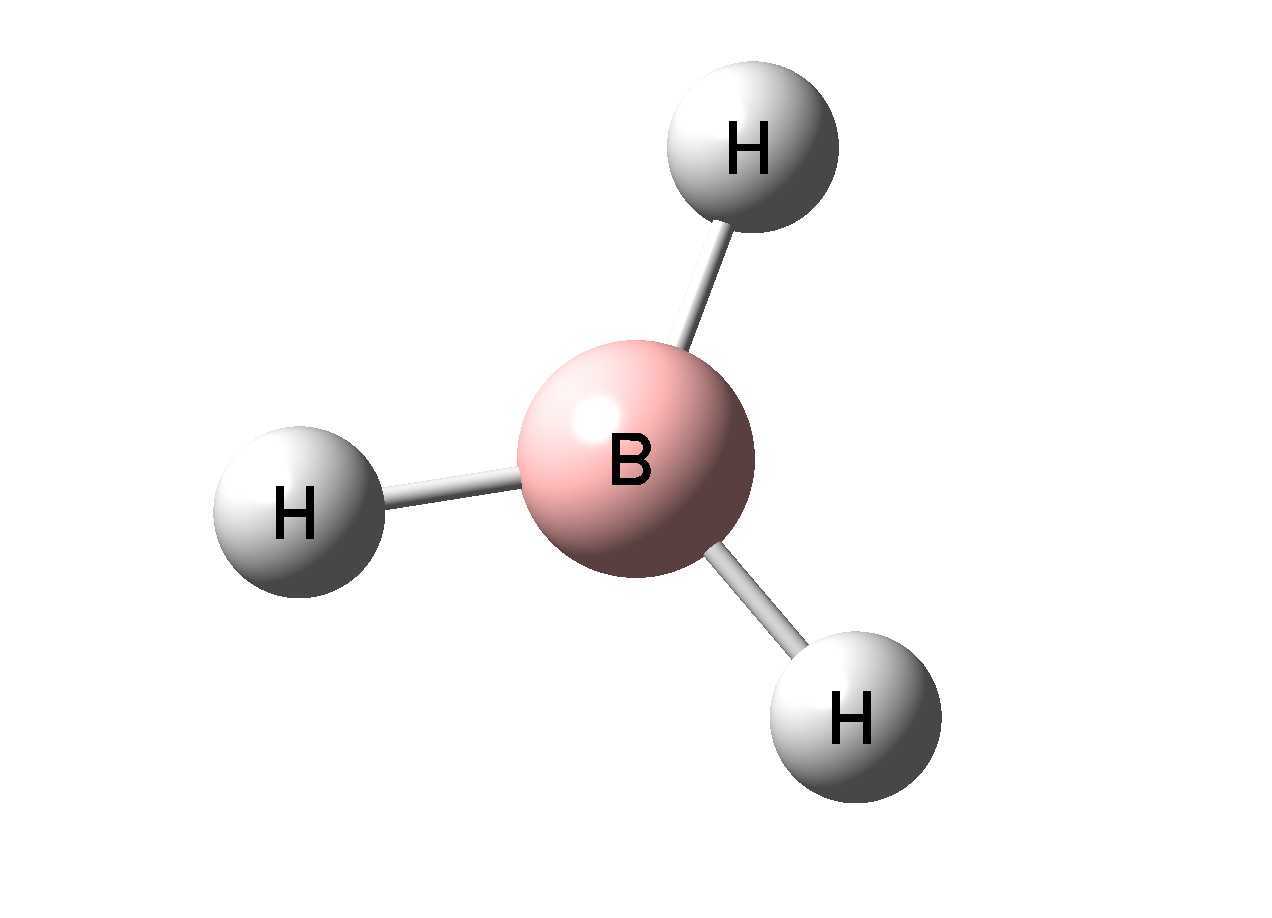
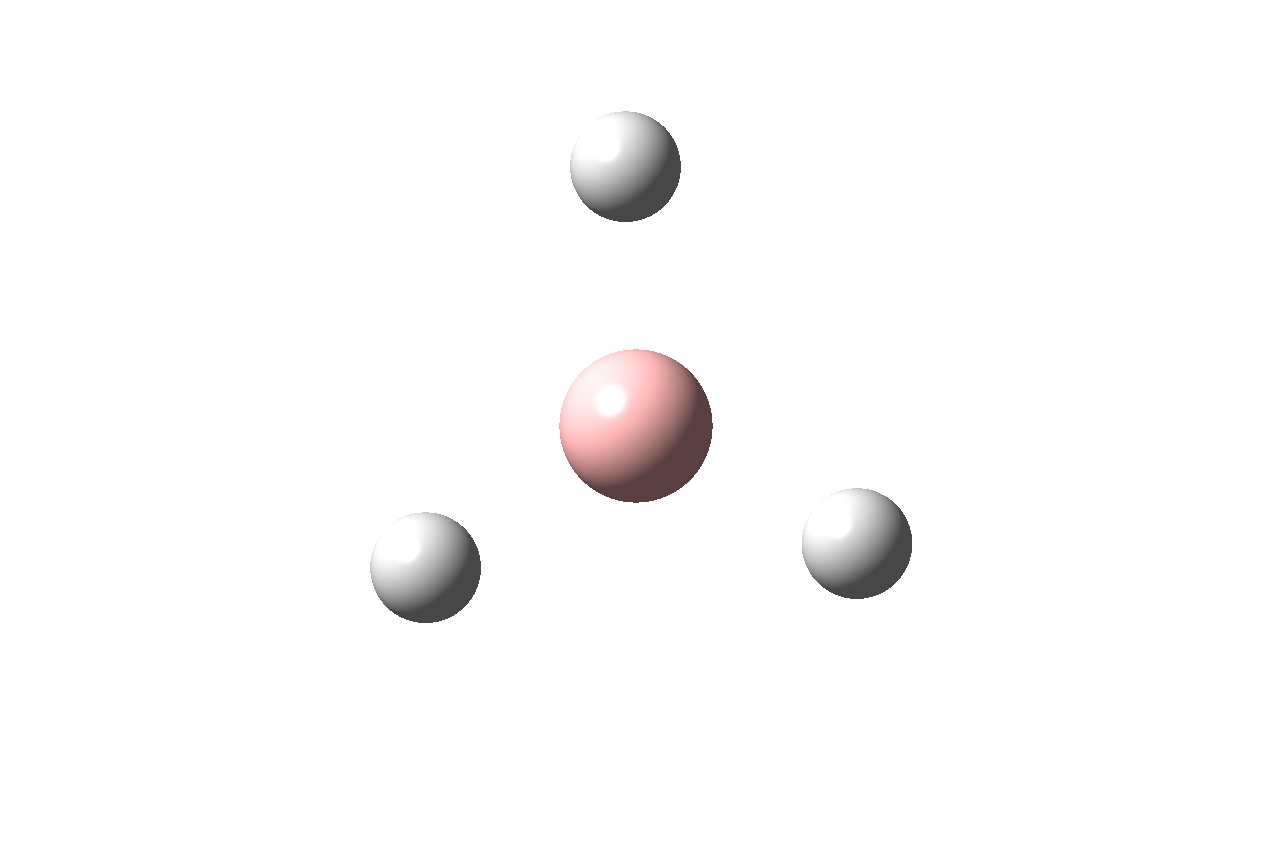
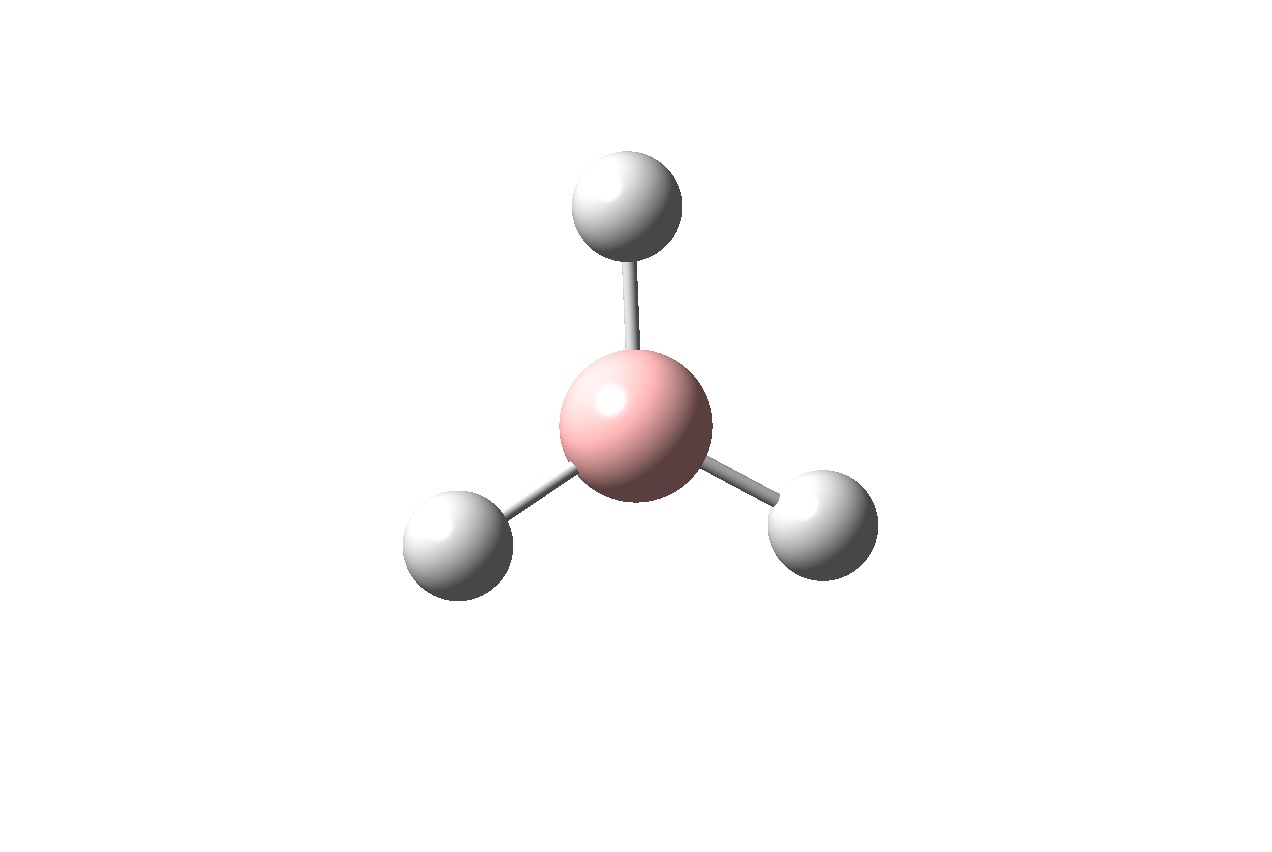
| 14:49, 9 March 2011 | Borane after optimisation.jpg (file) |  |
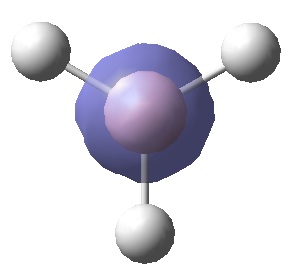
46 KB | Fig. 1: Borane after optimisation | 1 |
| 14:50, 9 March 2011 | Borane after optimisation jmol.mol (file) | 440 bytes | Fig. 1: Jmol of Borane after optimisation. | 1 | |
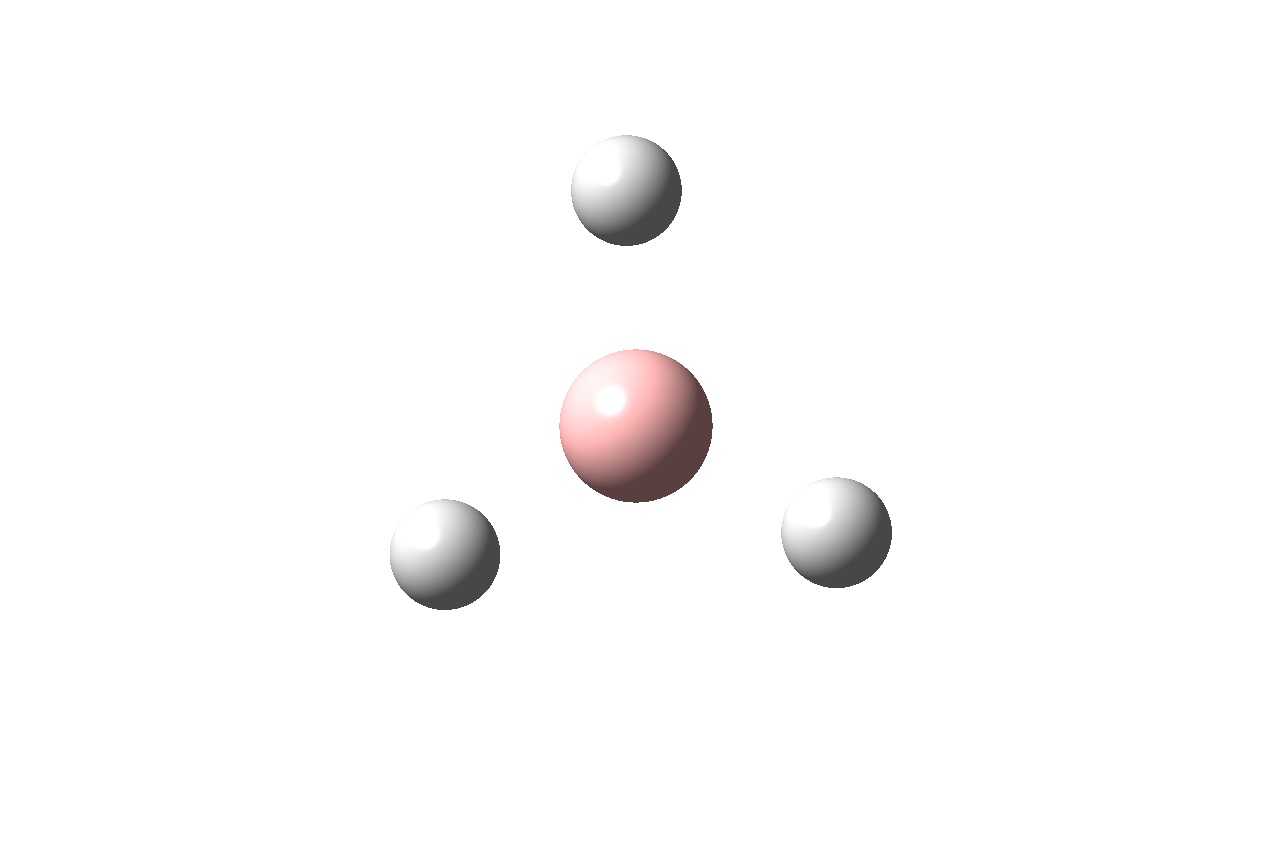
| 14:55, 9 March 2011 | Borane after optimisation 2.jpg (file) |  |
51 KB | Fig. 1: Image of Borane after optimisation. | 1 |
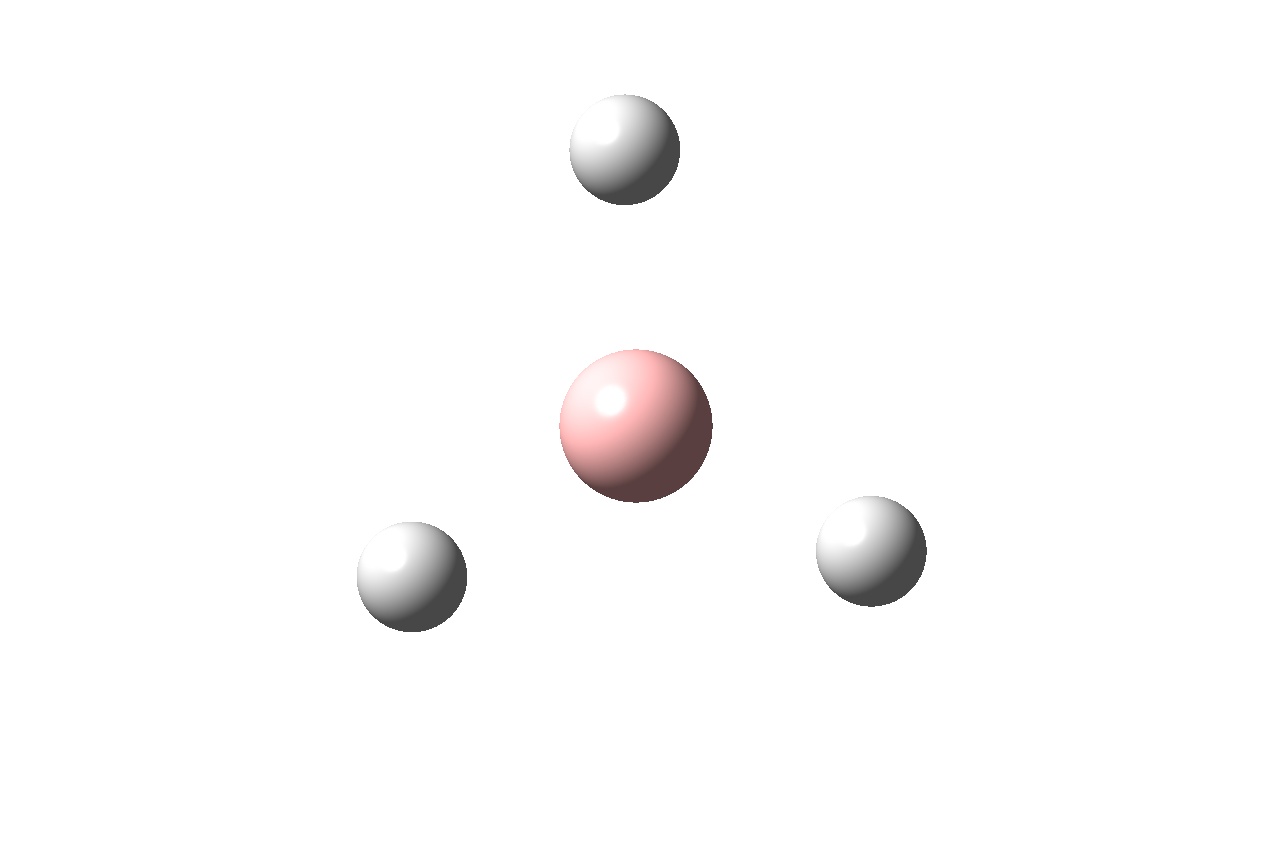
| 16:27, 9 March 2011 | Borane opt 1.jpg (file) |  |
31 KB | Step 1 jpg | 1 |
| 16:27, 9 March 2011 | Borane opt 1 Jmol.mol (file) | 371 bytes | Step 1 Jmol | 1 | |
| 16:27, 9 March 2011 | Borane opt 2 Jmol.mol (file) | 371 bytes | Step 2 Jmol | 1 | |
| 16:28, 9 March 2011 | Borane opt 2.jpg (file) |  |
31 KB | Step 2 jpg | 1 |
| 16:28, 9 March 2011 | Borane opt 3 Jmol.mol (file) | 371 bytes | Step 3 Jmol | 1 | |
| 16:28, 9 March 2011 | Borane opt 3.jpg (file) |  |
31 KB | Step 3 jpg | 1 |
| 16:29, 9 March 2011 | Borane opt 4 Jmol.mol (file) | 440 bytes | Step 4 Jmol | 1 | |
| 16:31, 9 March 2011 | Borane opt 4.jpg (file) |  |
34 KB | Step 4 jpg | 1 |
| 16:31, 9 March 2011 | Borane opt 5 Jmol.mol (file) | 440 bytes | Step 5 Jmol | 1 | |
| 16:32, 9 March 2011 | Borane opt 5.jpg (file) |  |
34 KB | Step 5 jpg | 1 |
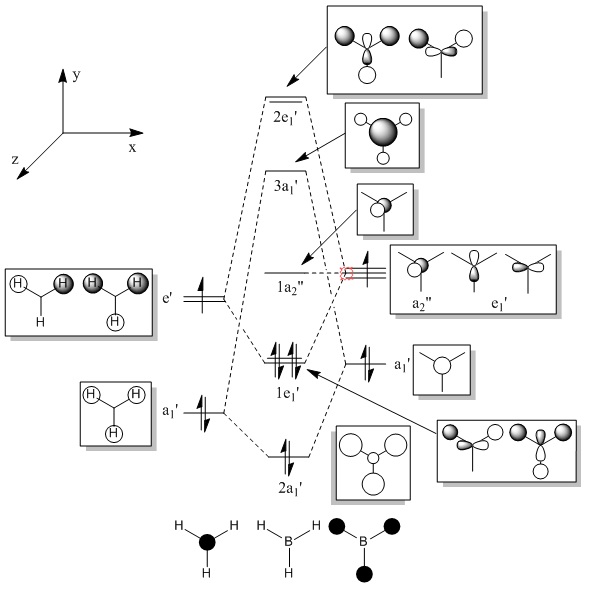
| 19:52, 9 March 2011 | MO diagram for BH3Tim.jpg (file) |  |
58 KB | 1 | |
| 19:56, 9 March 2011 | MO diagram for BH3 2tim.jpg (file) |  |
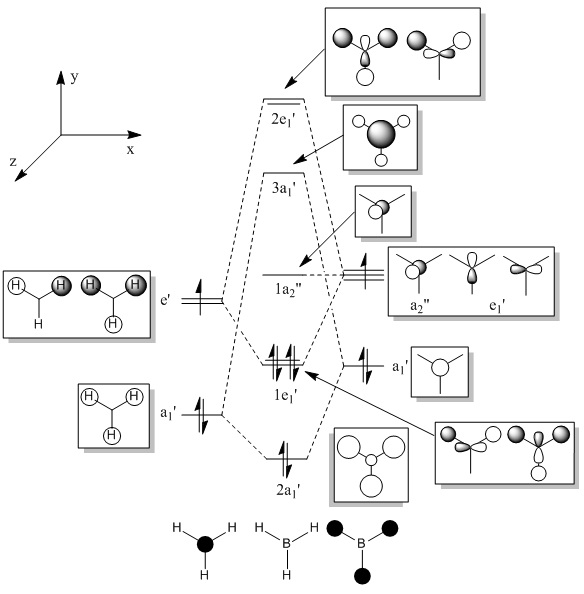
59 KB | Fig. 4: MO diagram for borane. | 1 |
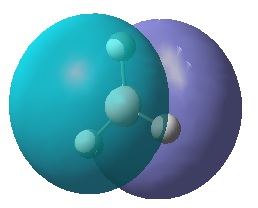
| 22:28, 9 March 2011 | BH3 MO 1tim.jpg (file) |  |
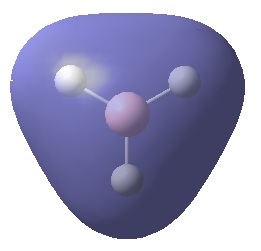
11 KB | BH3 HOMO-3 | 1 |
| 22:31, 9 March 2011 | BH3 MO 2tim.jpg (file) |  |
11 KB | BH3 HOMO-2 | 1 |
| 22:32, 9 March 2011 | BH3 MO 3tim.jpg (file) |  |
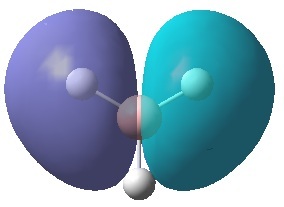
13 KB | BH3 HOMO-1 | 1 |
| 22:32, 9 March 2011 | BH3 MO 4tim.jpg (file) |  |
14 KB | BH3 HOMO | 1 |
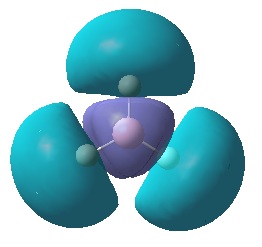
| 22:33, 9 March 2011 | BH3 MO 5tim.jpg (file) |  |
12 KB | LUMO | 1 |
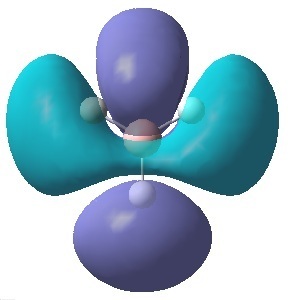
| 22:33, 9 March 2011 | BH3 MO 7tim.jpg (file) |  |
17 KB | LUMO+1 | 1 |
| 22:33, 9 March 2011 | BH3 MO 8tim.jpg (file) |  |
18 KB | LUMO+2 | 1 |
| 22:34, 9 March 2011 | BH3 MO 6tim.jpg (file) |  |
15 KB | LUMO+1 | 1 |
| 22:42, 9 March 2011 | BH3 ATTEMPT 2 MOS TRY 2.LOG (file) | 32 KB | 1 | ||
| 20:29, 10 March 2011 | BH3 chemdrawtim.cdx (file) | 21 KB | Fig. 4: The MO diagram for BH3. | 1 |