
Uploads by Jh3817
This special page shows all uploaded files.
| Date | Name | Thumbnail | Size | Description | Versions |
|---|---|---|---|---|---|
| 11:08, 19 March 2018 | NH3 OPT 01386810.LOG (file) | 228 KB | 1 | ||
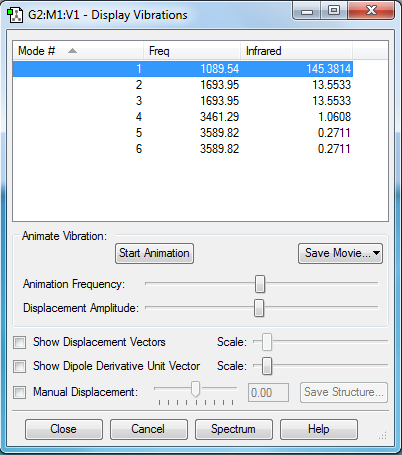
| 11:46, 19 March 2018 | Vibration window 01386810.docx (file) |  |
211 KB | 2 | |
| 20:17, 20 March 2018 | N2 print screen.png (file) |  |
41 KB | 2 | |
| 20:48, 20 March 2018 | H2 print screen.png (file) |  |
34 KB | 1 | |
| 22:08, 20 March 2018 | S2 OPT 2.LOG (file) | 277 KB | 1 | ||
| 22:12, 20 March 2018 | S2 PRINT SCREEN.png (file) |  |
36 KB | 1 | |
| 09:55, 22 March 2018 | 2s bonding orbital.png (file) |  |
85 KB | 1 | |
| 09:56, 22 March 2018 | 2s anti-bonding orbital.png (file) |  |
85 KB | 1 | |
| 10:19, 22 March 2018 | HOMO.png (file) |  |
92 KB | 11 | |
| 10:21, 22 March 2018 | HOMO 01386810.png (file) |  |
92 KB | 1 | |
| 10:22, 22 March 2018 | LUMO 01386810.png (file) |  |
78 KB | 1 | |
| 10:57, 22 March 2018 | S2 3p MO.png (file) |  |
91 KB | 1 | |
| 11:24, 22 March 2018 | NH3 vibration data JH.png (file) |  |
33 KB | 1 | |
| 14:53, 7 May 2019 | Saddle point.PNG (file) |  |
150 KB | 2 | |
| 15:13, 7 May 2019 | Saddle point JH.PNG (file) |  |
135 KB | 1 | |
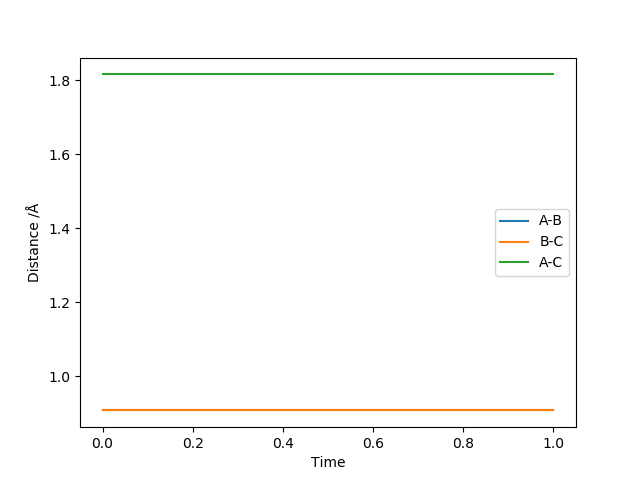
| 15:50, 7 May 2019 | Internuclear distance VS time JH.png (file) | 12 KB | 1 | ||
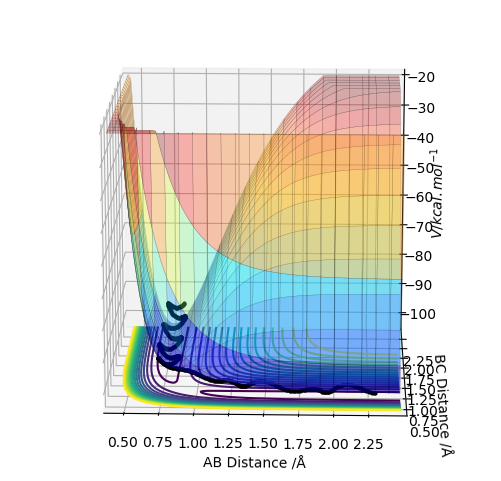
| 17:16, 7 May 2019 | Contour plot JH.png (file) |  |
106 KB | 1 | |
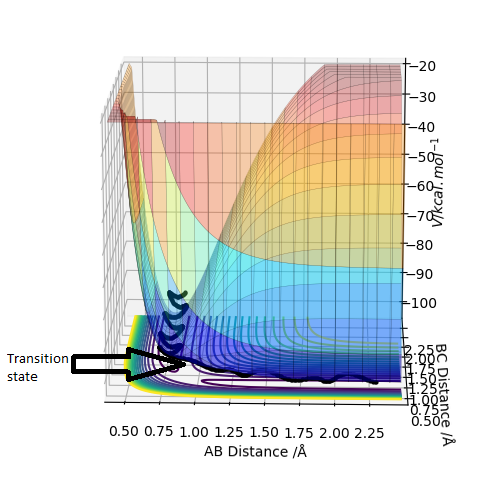
| 18:22, 7 May 2019 | MEP contour JH.png (file) |  |
107 KB | 1 | |
| 18:25, 7 May 2019 | Dynamic contour JH.png (file) |  |
107 KB | 1 | |
| 19:11, 7 May 2019 | Reverse internuclear distance vs time JH.png (file) | 28 KB | 1 | ||
| 19:12, 7 May 2019 | Reverse momentum vs time JH.png (file) |  |
31 KB | 1 | |
| 15:31, 8 May 2019 | -1.25 & -2.5 contour plot JH.png (file) |  |
110 KB | 1 | |
| 15:38, 8 May 2019 | -1.5 & -2.0 contour plot JH2.png (file) |  |
109 KB | 1 | |
| 15:46, 8 May 2019 | -1.5 & -2.5 contour plot JH2.png (file) |  |
110 KB | 1 | |
| 15:54, 8 May 2019 | -2.5 & -5 contour plot JH.png (file) |  |
115 KB | 1 | |
| 16:00, 8 May 2019 | -2.5 & -5.2 contour plot JH.png (file) |  |
116 KB | 1 | |
| 17:53, 8 May 2019 | HF + H Surface Plot JH.png (file) |  |
172 KB | 1 | |
| 18:11, 8 May 2019 | H2 + F Surface Plot JH.png (file) |  |
188 KB | 1 | |
| 13:24, 9 May 2019 | TS Surface Plot JH.png (file) |  |
14 KB | 1 | |
| 13:29, 9 May 2019 | TS Contour Plot JH.png (file) |  |
107 KB | 1 | |
| 14:55, 9 May 2019 | Working reaction energy-time graph JH.png (file) |  |
46 KB | 1 | |
| 15:25, 9 May 2019 | Momentum VS time graph JH.png (file) |  |
46 KB | 1 | |
| 15:54, 9 May 2019 | -3 momentum.png (file) |  |
118 KB | 1 | |
| 15:56, 9 May 2019 | -1.5 momentum.png (file) |  |
123 KB | 1 | |
| 15:59, 9 May 2019 | 0 momentum.png (file) |  |
130 KB | 1 | |
| 16:04, 9 May 2019 | 1.5 momentum.png (file) |  |
122 KB | 1 | |
| 16:26, 9 May 2019 | 3 momentum.png (file) |  |
128 KB | 1 | |
| 17:52, 9 May 2019 | Energy VS Time graph for H2 +F activation energy.png (file) |  |
25 KB | 1 | |
| 17:58, 9 May 2019 | Energy VS Time graph for H2 +F activation energy JH.png (file) |  |
27 KB | 1 | |
| 19:11, 9 May 2019 | Reverse reaction contour plot.png (file) |  |
114 KB | 2 | |
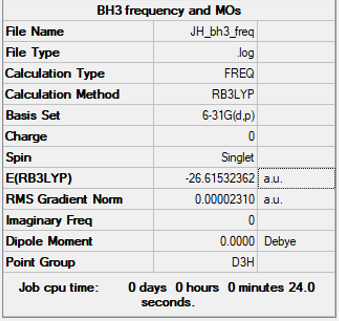
| 13:23, 21 May 2019 | BH3 info.PNG (file) |  |
63 KB | 1 | |
| 13:38, 21 May 2019 | JH BH3 FREQ.LOG (file) | 138 KB | 1 | ||
| 13:46, 21 May 2019 | JH BH3 D3H.gjf (file) | 456 bytes | 1 | ||
| 13:50, 21 May 2019 | NH3 picture.tif (file) | 511 KB | 1 | ||
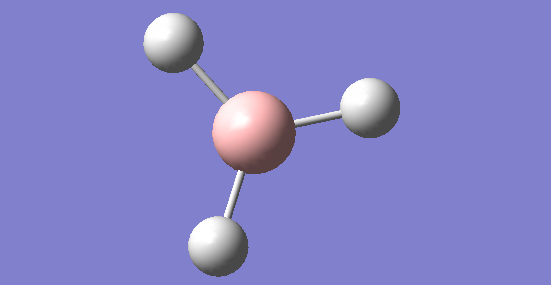
| 13:55, 21 May 2019 | BH3 picture.PNG (file) |  |
27 KB | 1 | |
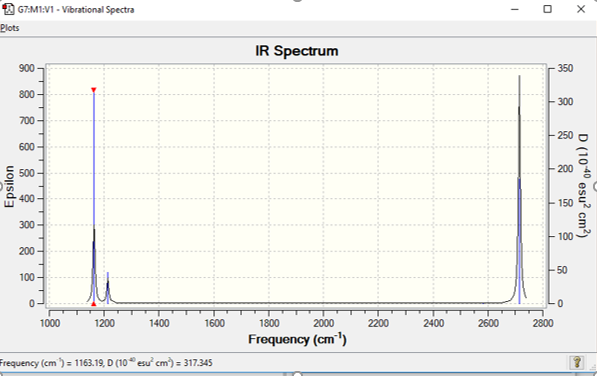
| 14:26, 21 May 2019 | BH3 vibrations spectrum JH.PNG (file) |  |
84 KB | 1 | |
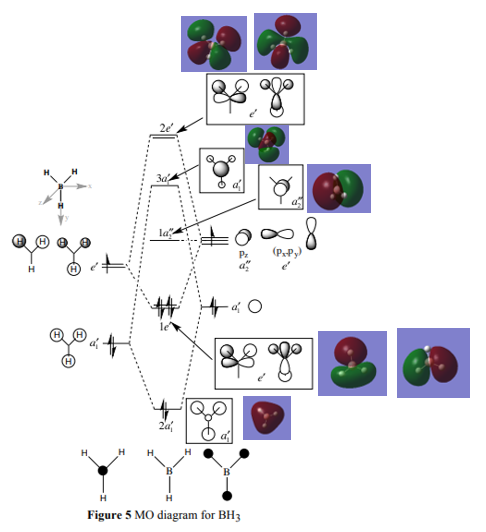
| 14:30, 21 May 2019 | MO diagram.PNG (file) |  |
80 KB | 6 | |
| 14:31, 21 May 2019 | MO diagram JH.PNG (file) |  |
80 KB | 1 | |
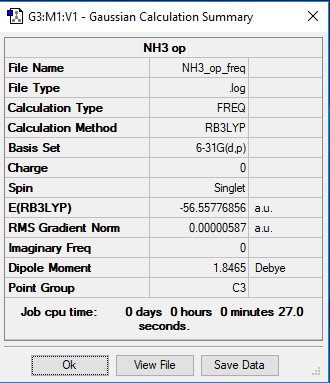
| 14:37, 21 May 2019 | NH3 summary table JH.PNG (file) |  |
14 KB | 1 | |
| 14:51, 21 May 2019 | NH3 OP JH.LOG (file) | 71 KB | 1 |